Yellowstone Plume, Hotspot, Teton Fault, and Wasatch Front Earthquake Research
|
|
|
|
|
||||||||||||||||||||||||||||||||||||||||||||||||||||||||||||||||||||||||||||||||||||||||||||||||||||||||||||||||||||||||||||||||||||||||||||||||||||||||||||||||||||||||||||||||||||||||||||||||||||||||||||||||||||||||||||||||||||||||||||||||||||||||||||||||||||||||||||||||||||||||||||||||||||||||||||||||||||||||||||||||||||||||||||||||||||||||||||||||||||||||||||||||||||||||||||||||||||||||||||||||||||||||||||||||||||||||||||||||||||||||||||||||||||||||||||||||||||||||||||||||||||||||||||||||||||||||||||||||||||||||||||||||||||||||||||||||||||||||||||||||||||||||||||||||||||||||||||||||||||||||||||||||||||||||||||||||||||||||||||||||||||||||||||||||||||||||||||||||||||||||||||||||||||||||||||||||||||||||||||||||||||||||||||||||||||||||||||||||||||||||||||||||||||||||||||||||||||||||||||||||||||||||||||||||||||||||||||||||||||||||||||||||||||||||||
| More about this article. | More about the article. | ||||||||||||||||||||||||||||||||||||||||||||||||||||||||||||||||||||||||||||||||||||||||||||||||||||||||||||||||||||||||||||||||||||||||||||||||||||||||||||||||||||||||||||||||||||||||||||||||||||||||||||||||||||||||||||||||||||||||||||||||||||||||||||||||||||||||||||||||||||||||||||||||||||||||||||||||||||||||||||||||||||||||||||||||||||||||||||||||||||||||||||||||||||||||||||||||||||||||||||||||||||||||||||||||||||||||||||||||||||||||||||||||||||||||||||||||||||||||||||||||||||||||||||||||||||||||||||||||||||||||||||||||||||||||||||||||||||||||||||||||||||||||||||||||||||||||||||||||||||||||||||||||||||||||||||||||||||||||||||||||||||||||||||||||||||||||||||||||||||||||||||||||||||||||||||||||||||||||||||||||||||||||||||||||||||||||||||||||||||||||||||||||||||||||||||||||||||||||||||||||||||||||||||||||||||||||||||||||||||||||||||||||||||||||||
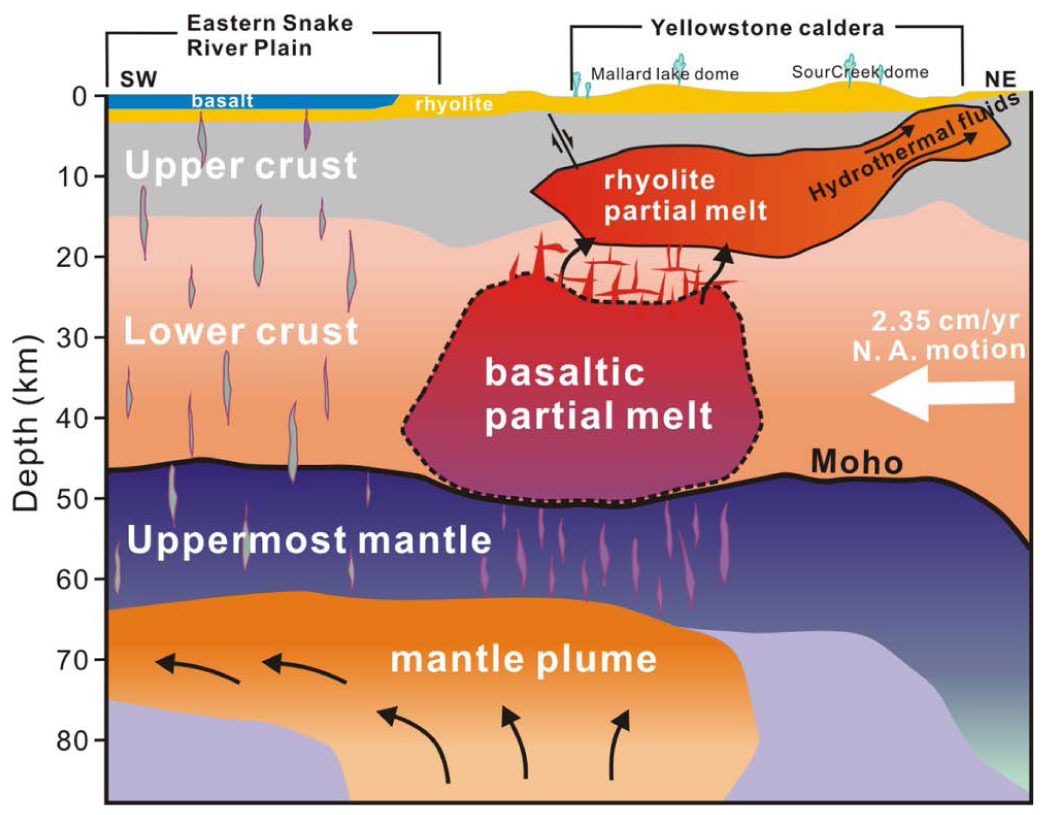
Published in Science in 2015
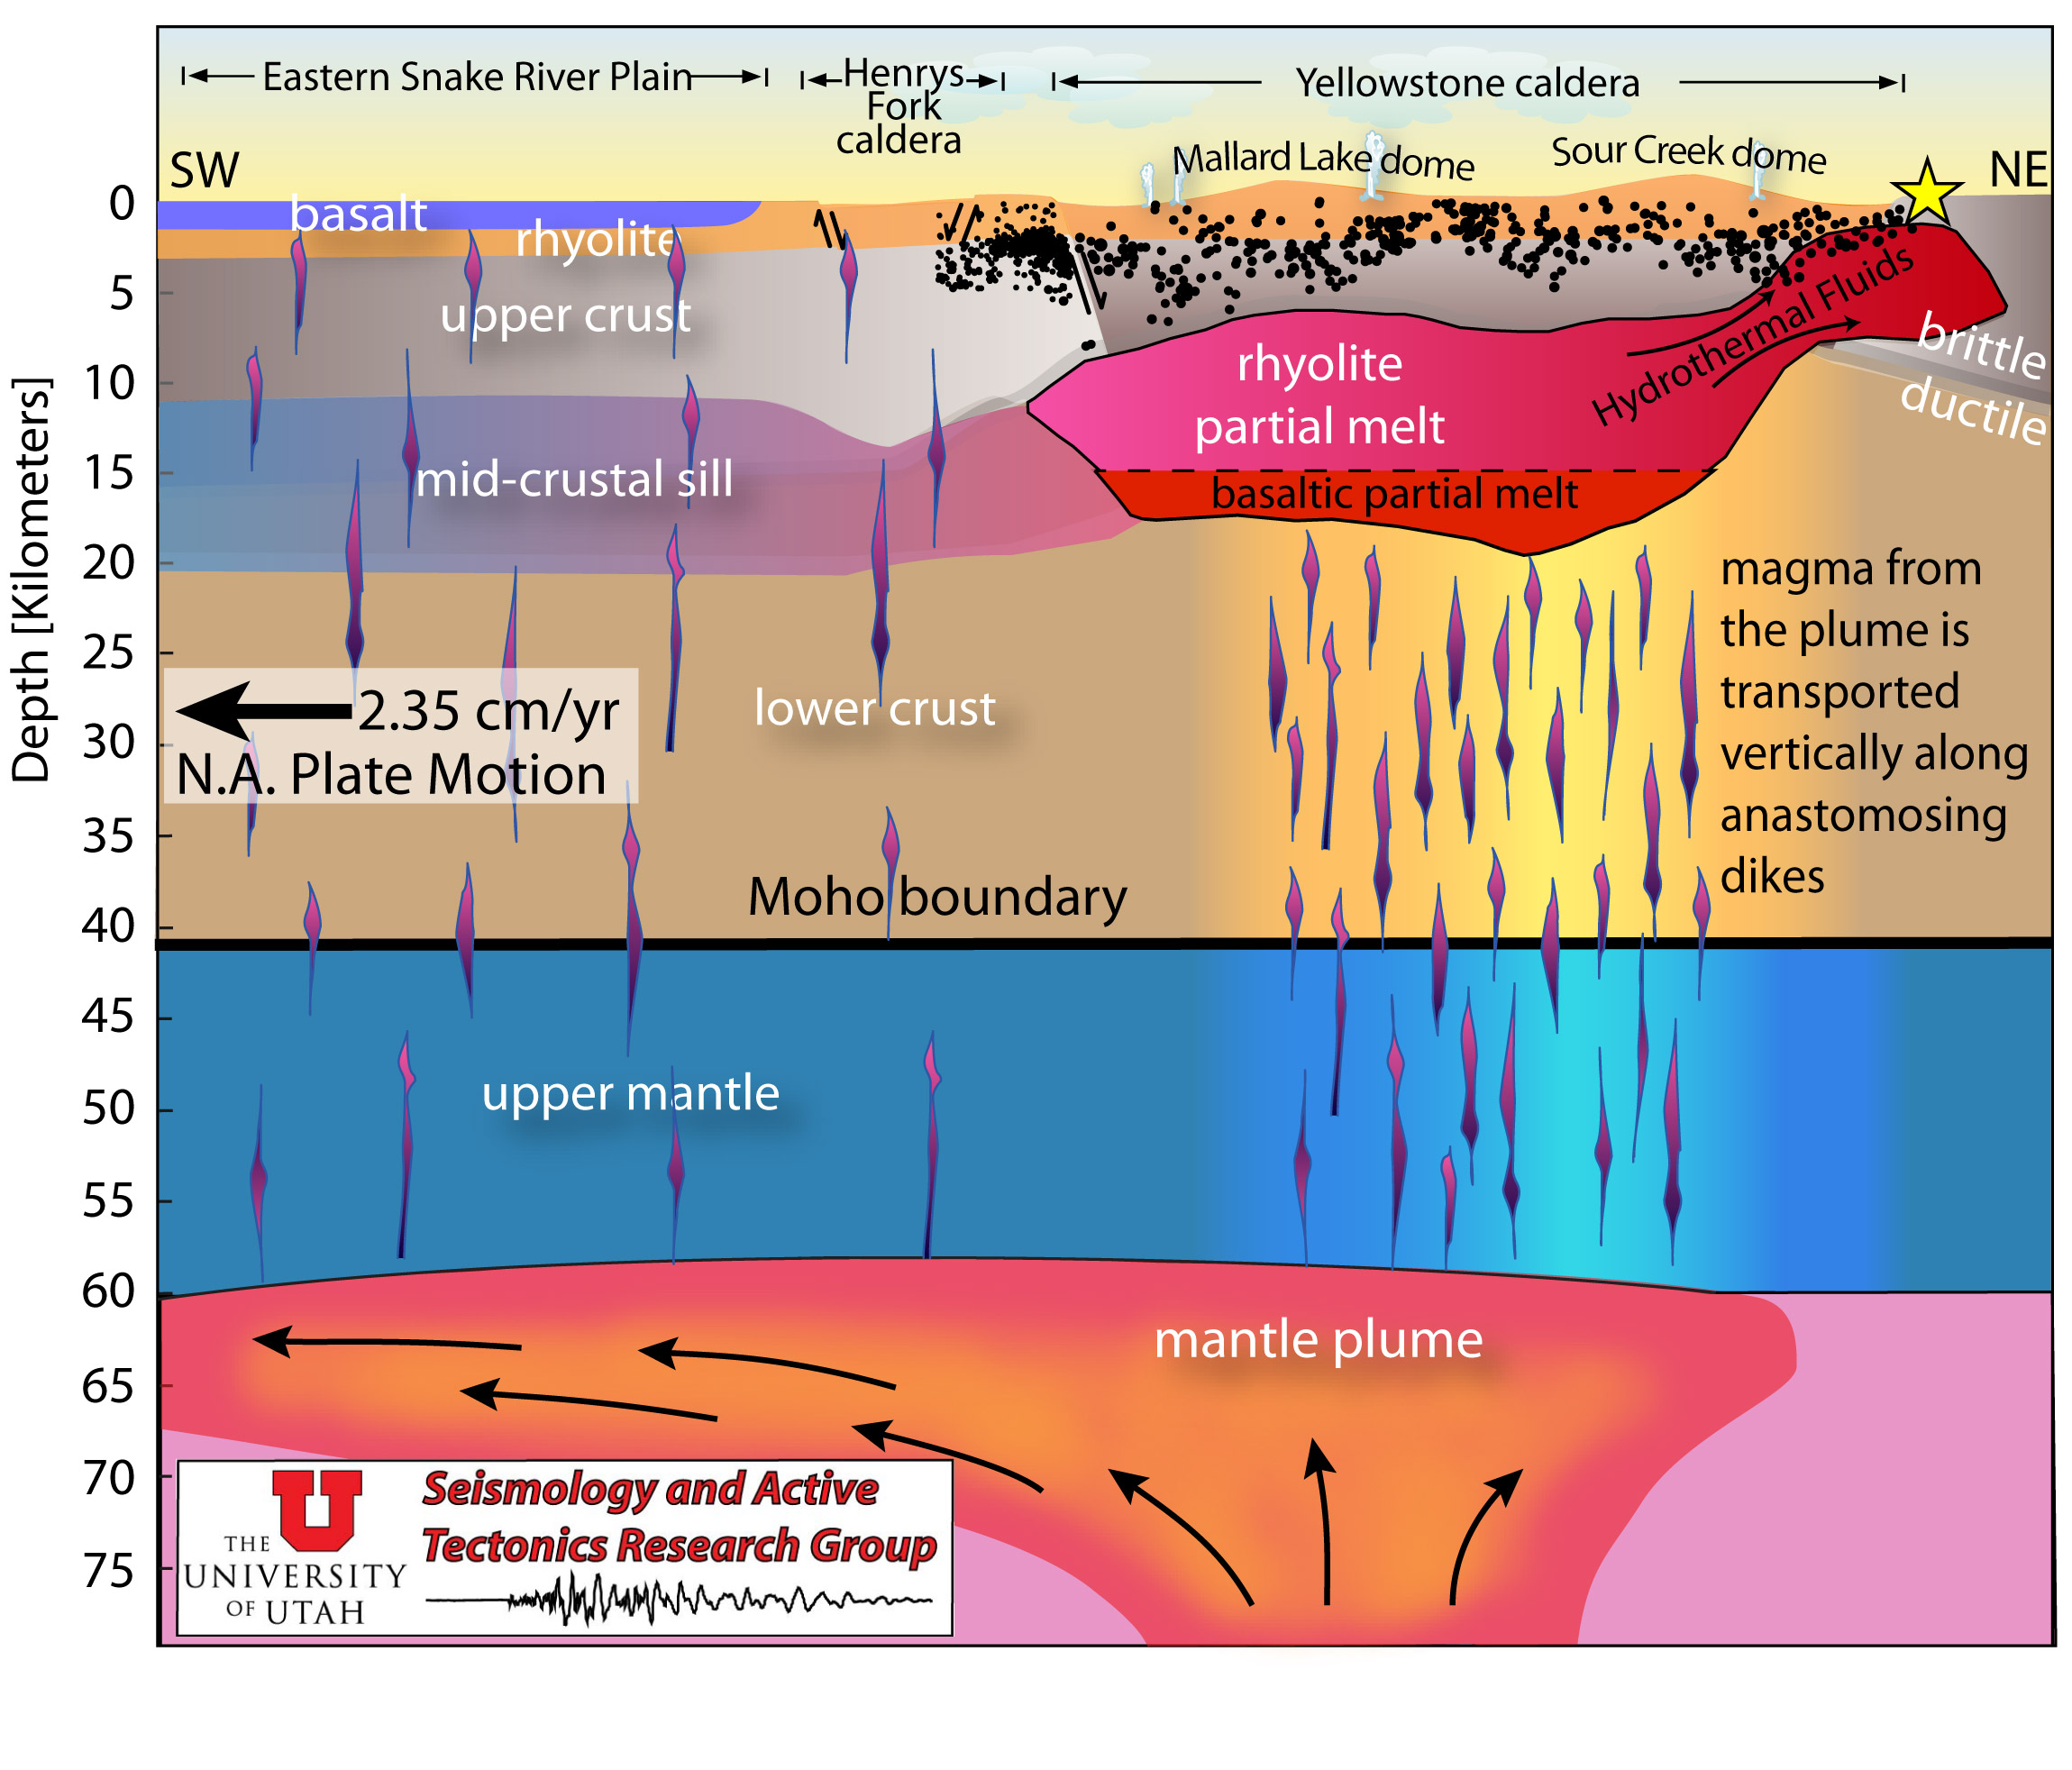
The Yellowstone supervolcano is one of the largest active continental silicic volcanic fields in the world. An understanding of its properties is key to enhancing our knowledge of volcanic mechanisms and corresponding risk. Using a joint local and teleseismic earthquake P-wave seismic inversion, we unveil a basaltic lower-crustal magma body that provides a magmatic link between the Yellowstone mantle plume and the previously imaged upper-crustal magma reservoir. This lower-crustal magma body has a volume of 46,000 km3, ~4.5 times larger than the upper-crustal magma reservoir, and contains a melt fraction of ~2%. These estimates are critical to understanding the evolution of bimodal basaltic-rhyolitic volcanism, explaining the magnitude of CO2 discharge, and constraining dynamic models of the magmatic system for volcanic hazard assessment.
More Information:
|
|
|
||||||||||||||||||||||||||||||||||||||||||||||||||||||||||||||||||||||||||||||||||||||||||||||||||||||||||||||||||||||||||||||||||||||||||||||||||||||
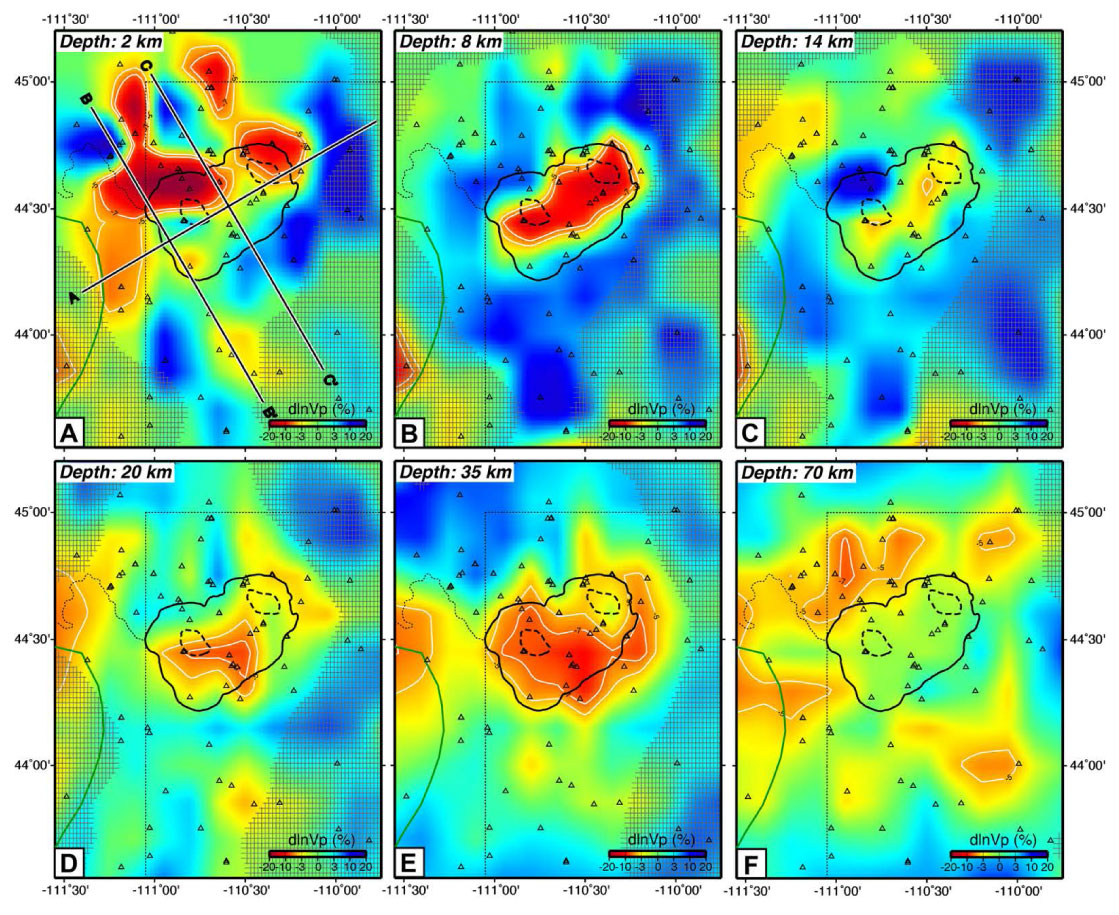
Published in Geophysical Research Letters in 2014
The Yellowstone volcanic field has experienced three of Earth's most explosive volcanic eruptions in the last 2.1 million years. The most recent eruption occurred 0.64 Ma forming the 60 km long Yellowstone caldera. We have compiled earthquake data from the Yellowstone Seismic Network, from 1984-2011 and tomographically imaged the three-dimensional P-wave velocity (Vp) structure of the Yellowstone volcanic system. The resulting model reveals a large, low Vp body; interpreted to be the crustal magma reservoir that has fueled Yellowstone's youthful volcanism. Our imaged magma body is 90 km long and 5-17 km deep, and 2.5 times larger than previously imaged. The magma body extends ~15 km NE of the caldera and correlates with the location of the largest negative gravity anomaly, a -80 mGal gravity low. This new seismic image provides important constraints on the dynamics of the Yellowstone magma system and its potential for future volcanic eruptions and earthquakes.
More Information:
|
|

|
||||||||||||||||||||||||||||||||||||||||||||||||||||||||||||||||||||||||||||||||||||||||||||||||||||||||||||||||||||||||||||||||||||||||||||||||||||||
Published in the Journal of Geophysical Research in 2013
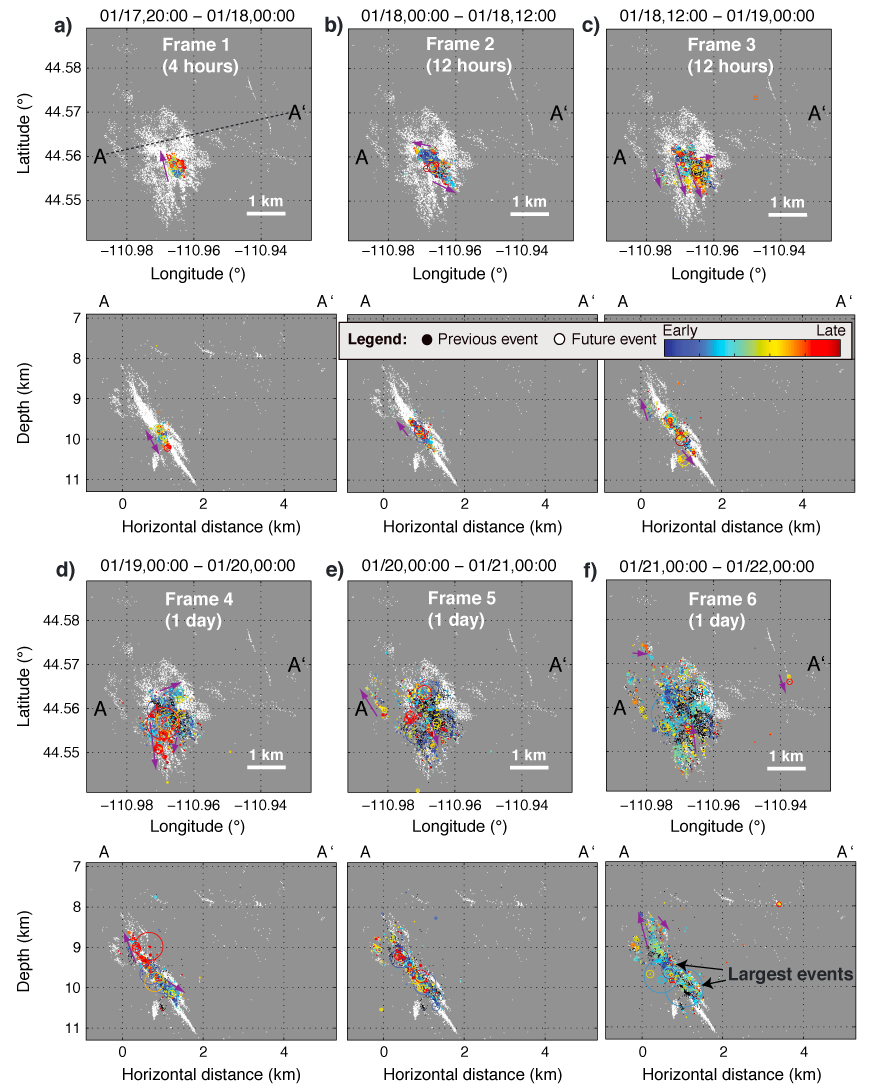
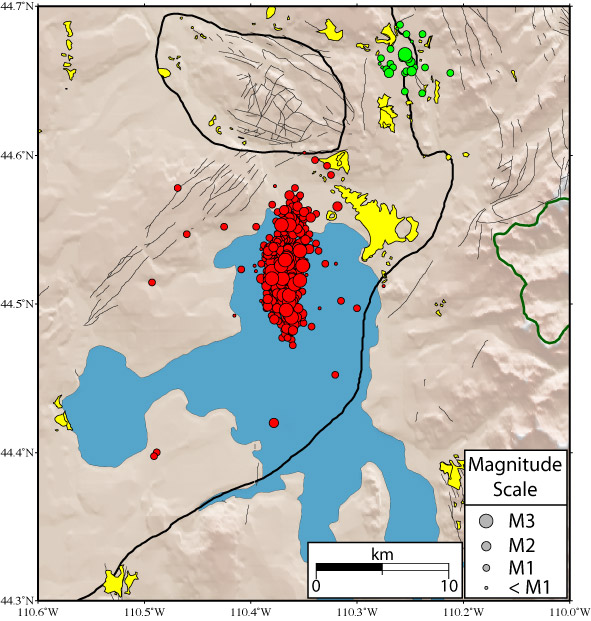
Over the past several decades, the Yellowstone caldera has experienced frequent earthquake swarms and repeated cycles of uplift and subsidence, reflecting dynamic volcanic and tectonic processes. Here we examine the detailed spatial-temporal evolution of the 2010 Madison Plateau swarm, which occurred near the northwest boundary of the Yellowstone caldera. To fully explore the evolution of the swarm, we integrated procedures for seismic waveform-based earthquake detection with precise double-difference relative relocation. Using cross correlation of continuous seismic data and waveform templates constructed from cataloged events, we detected and precisely located 8710 earthquakes during the 3 week swarm, nearly 4 times the number of events included in the standard catalog. This high-resolution analysis reveals distinct migration of earthquake activity over the course of the swarm. The swarm initiated abruptly on 17 January 2010 at about 10 km depth and expanded dramatically outward (both shallower and deeper) over time, primarily along a NNW striking, ~55° ENE dipping structure. To explain these characteristics, we hypothesize that the swarm was triggered by the rupture of a zone of confined high-pressure aqueous fluids into a preexisting crustal fault system, prompting release of accumulated stress. The high-pressure fluid injection may have been accommodated by hybrid shear and dilatational failure, as is commonly observed in exhumed hydrothermally affected fault zones. This process has likely occurred repeatedly in Yellowstone as aqueous fluids exsolved from magma migrate into the brittle crust, and it may be a key element in the observed cycles of caldera uplift and subsidence.
More Information:
|
|
||||||||||||||||||||||||||||||||||||||||||||||||||||||||||||||||||||||||||||||||||||||||||||||||||||||||||||||||||||||||||||||||||||||||||||||||||||||
Published in Journal of Volcanology and Geothermal Research in 2013
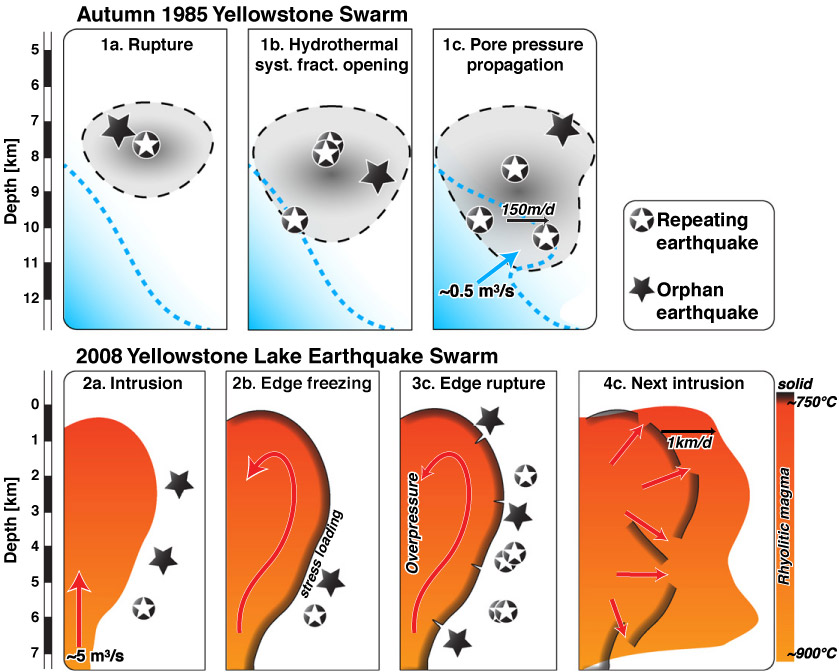
We evaluated properties of Yellowstone earthquake swarms employing waveform multiplet analysis. Thirty-seven percent of the earthquakes in the Yellowstone caldera occur in multiplets and generally intensify in areas undergoing crustal subsidence. Outside the caldera, in the Hedgen Lake tectonic area, the clustering rate is higher, up to 75%. The Yellowstone seismicity follows a succession of two phases of earthquake sequence. The first phase is defined between swarms. It is characterized by a decay of clustering rate and by foreshock-aftershock sequences. The second phase is confined to swarms and is characterized by an increase in clustering rate, and dominant aftershock sequences. This phase reflects tectonic swarms that occur on short segments of optimally oriented faults. For example, the largest recorded swarm in Yellowstone occurred in autumn 1985 on the northwest side of the Yellowstone Plateau which was initiated as a tectonic source sequence. Fitting experimental dependence of fluid injection with intrusion migration suggests that the 1985 swarm involved, after 10 days, hydrothermal fluids flowing outward from the caldera. The 2008-2009 Yellowstone Lake swarm exhibited a high migration rate of 1 km/day, a decrease in clustering rate without a main-shock, and appears to be associated with magma injection of 1 to 5 m3/s in a succession of migrating magma fronts that incrementally solidify and fracture at its brittle edges. The 2010 Madison Plateau earthquake swarm on the west side of the caldera initiated as a tectonic sequence but the expansion of the swarm front was associated with hydrothermal fluid migration.
More Information:
|
|
||||||||||||||||||||||||||||||||||||||||||||||||||||||||||||||||||||||||||||||||||||||||||||||||||||||||||||||||||||||||||||||||||||||||||||||||||||||
Published in Geochemistry, Geophysics, Geosystems in 2013
The 1959 Mw 7.3 Hebgen Lake, MT, normal-faulting earthquake occurred in an extensional stress regime near the Yellowstone volcanic field. Time-dependent crustal deformation data following this major earthquake were acquired by precise trilateration and GPS surveys from 1973 to 2000 around the Hebgen Lake fault zone. Modeling the changes of baseline lengths across and near the fault reveals a lateral variation of transient rheology, in which the lithosphere is stronger near the Hebgen Lake fault zone than in the vicinity of the Yellowstone volcano system. The models also imply that the lower crust is stronger than the upper mantle, in agreement with results from studies of postseismic and post-lake-filling relaxations (<~100 years). In addition, evaluations of the postseismic motion produced by the Hebgen Lake and the 1983 Mw 6.9 Borah Peak, ID, earthquakes indicate that horizontal transient motion of up to ~1 mm/yr contribute significantly to the contemporary regional crustal deformation near the epicentral areas. For the eastern Basin and Range, ~500 km south of the Hebgen Lake fault, similar rheologic models were derived from the observed uplift associated with the Lake Bonneville rebound and were used to evaluate the postseismic deformation associated with six most recent paleoearthquakes of the Wasatch fault zone and three M≥5.6 historic earthquakes of northern Utah. The results show ≤0.1 mm/yr of horizontal postseismic motion at present time that are within the horizontal uncertainties of continuous GPS velocity from the Basin and Range and significantly smaller than the contemporary extension of 1-3 mm/yr in the Wasatch Front.
More Information:
|
|
||||||||||||||||||||||||||||||||||||||||||||||||||||||||||||||||||||||||||||||||||||||||||||||||||||||||||||||||||||||||||||||||||||||||||||||||||||||
Published in Geophysical Research Letters in April 2011
Interpretation of the EarthScope MT (magnetotelluric) data requires the development of a large-scale inversion method which can address two common problems of 3D MT inversion: computational time and memory requirements. We have developed an efficient method of 3D MT inversion based on an IE (integral equation) formulation of the MT forward modeling problem and a receiver footprint approach, implemented as a massively parallel algorithm. This method is applied to the MT data collected in the western United States as a part of the EarthScope project. As a result, we present one of the first 3D geoelectrical images of the upper mantle beneath Yellowstone revealed by this large-scale 3D inversion of the EarthScope MT data. These images show a highly conductive body associated with the tomographically imaged mantle plume-like layer of hot material rising from the upper mantle toward the Yellowstone volcano. The conductive body identified in these images is west-dipping in a similar way to a P-wave low-velocity body.
More Information:
|
|
||||||||||||||||||||||||||||||||||||||||||||||||||||||||||||||||||||||||||||||||||||||||||||||||||||||||||||||||||||||||||||||||||||||||||||||||||||||
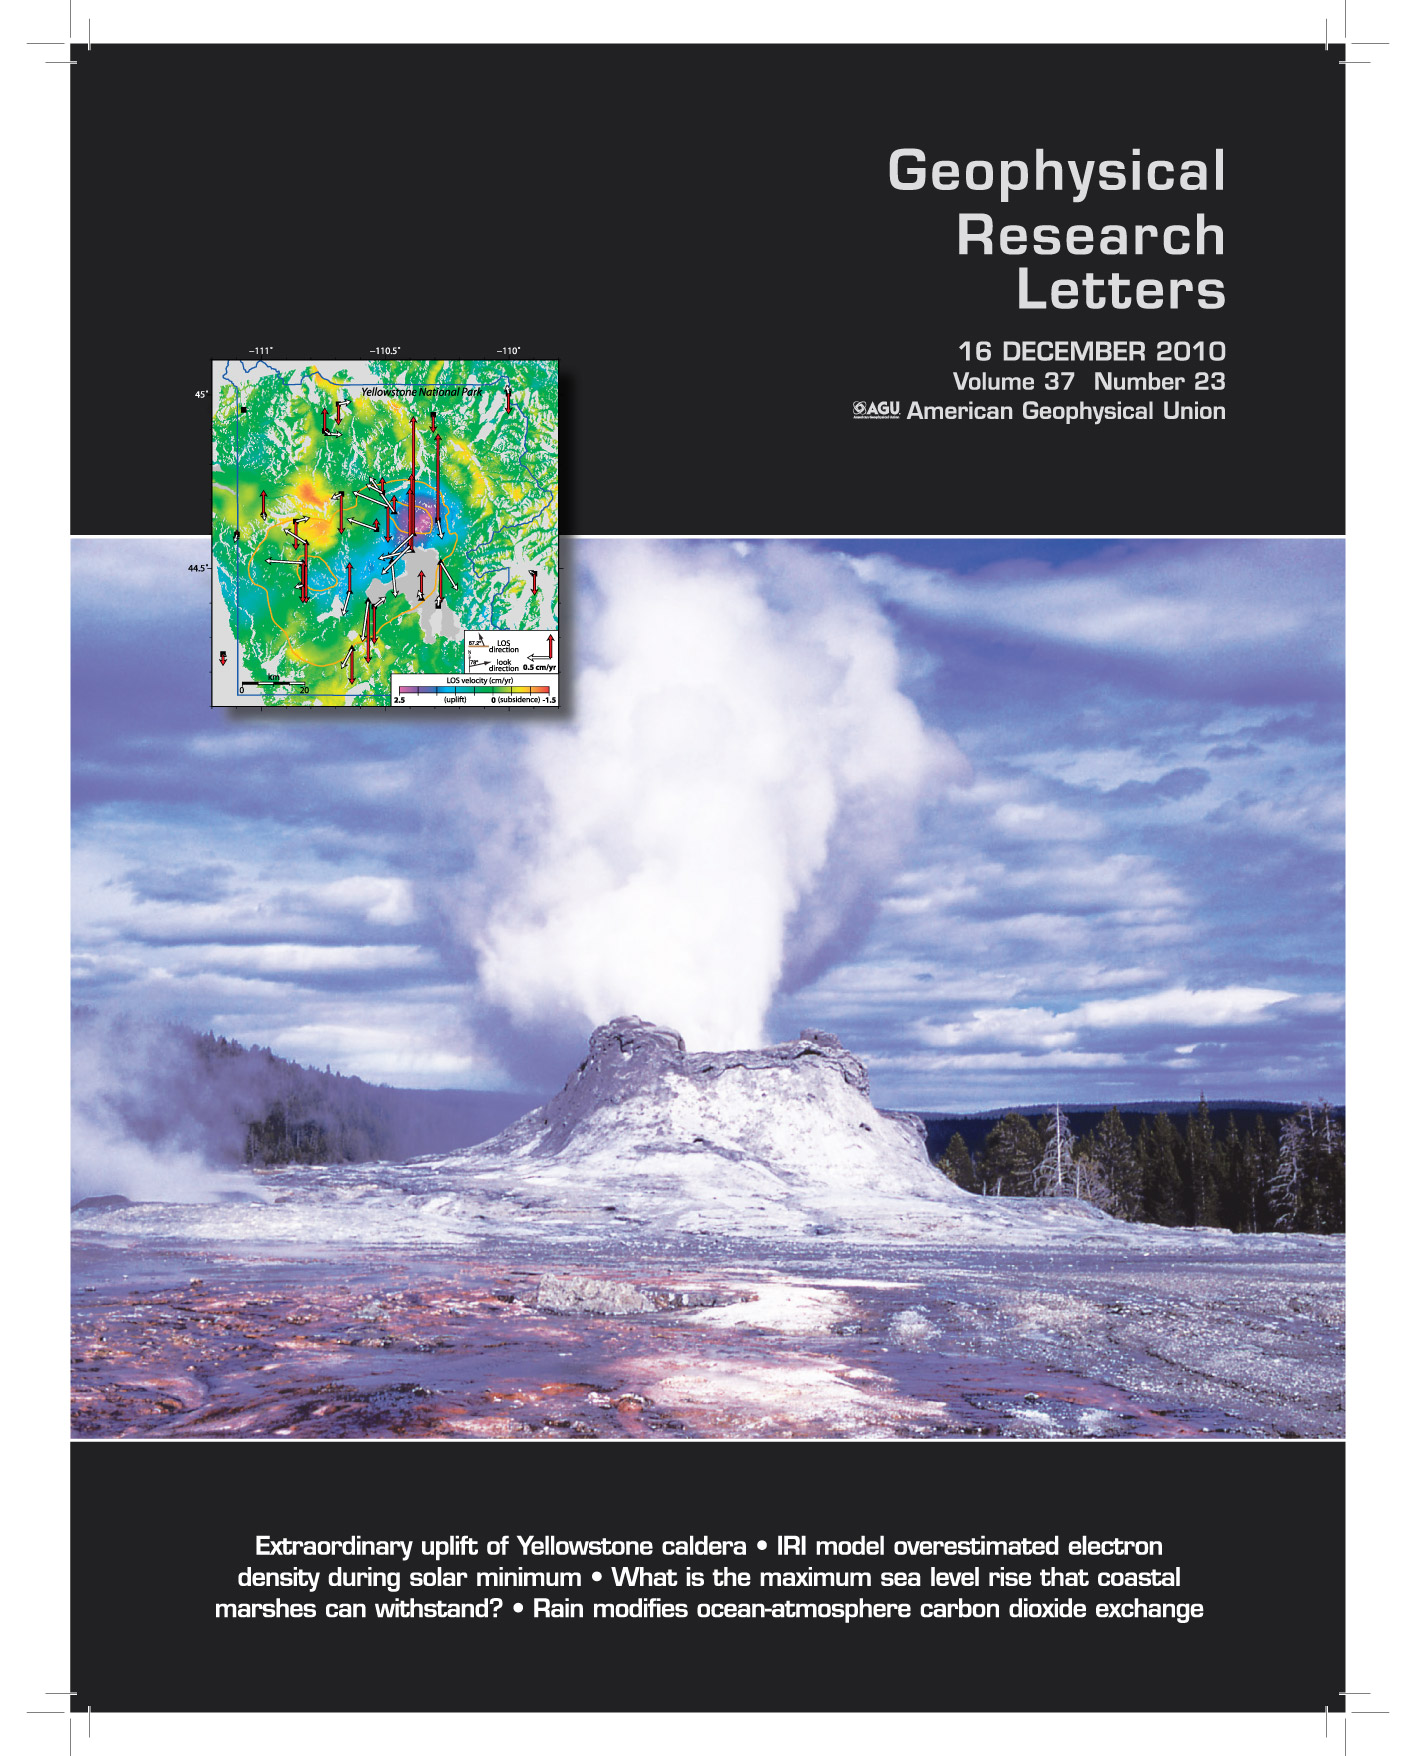
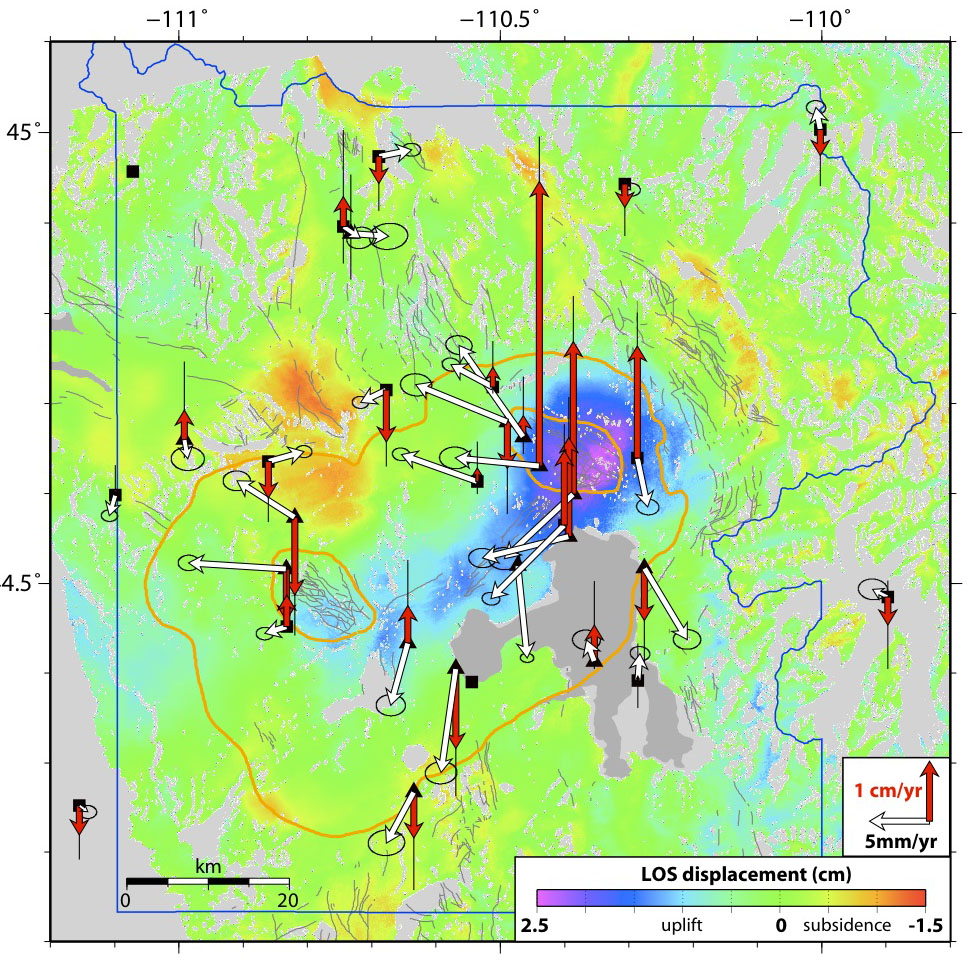
Published in Geophysical Research Letters in December 2010
Beginning in 2004, the Yellowstone caldera experienced rapid uplift at up to 7 cm/yr. Subsequent geodetic measurements have revealed that uplift rates have been decreasing since 2006, and by 2009 had been reduced to 2 cm/yr and 0.5 cm/yr in the northeast and southwest, respectively. Modeling shows that the deformation source is an expanding sill at the top of the magma reservoir, and that expansion rates had decreased by 60% since 2006. Moment release from two large swarms in 2008 and 2009 may also have contributed to reduced uplift rates.
More Information:
|
|
||||||||||||||||||||||||||||||||||||||||||||||||||||||||||||||||||||||||||||||||||||||||||||||||||||||||||||||||||||||||||||||||||||||||||||||||||||||
Published in Geophysical Research Letters in October 2010
The 2008-2009 Yellowstone Lake earthquake was the largest swarm since the 1985 swarm. The swarm began on December 27, 2008, below Yellowstone Lake. Over the next 12 days, hypocenters migrated north at 1 km per day, and maximum earthquake focal depths shallowed from 12 km to 2 km. At the same time, the nearest GPS stations experienced E-W opening. The moment tensor solution for the largest earthquake in the swarm, a M4.1 event, revealed a source component 50% tensile crack opening. Modeling of the GPS and seismic data indicates ~10 cm of opening on a vertical, north- striking dike. Based on the data and models, the swarm was likely induced by magmatic fluid migration or propagation of stress pulse along a pre-existing fracture zone.
More Information:
|
|
||||||||||||||||||||||||||||||||||||||||||||||||||||||||||||||||||||||||||||||||||||||||||||||||||||||||||||||||||||||||||||||||||||||||||||||||||||||
The University of Utah Seismology and Active Tectonics Research Group has released a white paper summarizing our GPS research and related monitoring on October 14, 2010. The University of Utah research group uses high precision GPS methodology to measure ground motions of the Yellowstone-Snake River Plain volcanic field and the Wasatch fault, Utah. The report summarizes the University of Utah GPS recording and processing scheme and gives an overview of scientific findings and new research directions.
Published in Journal of Geophysical Research in January 2010
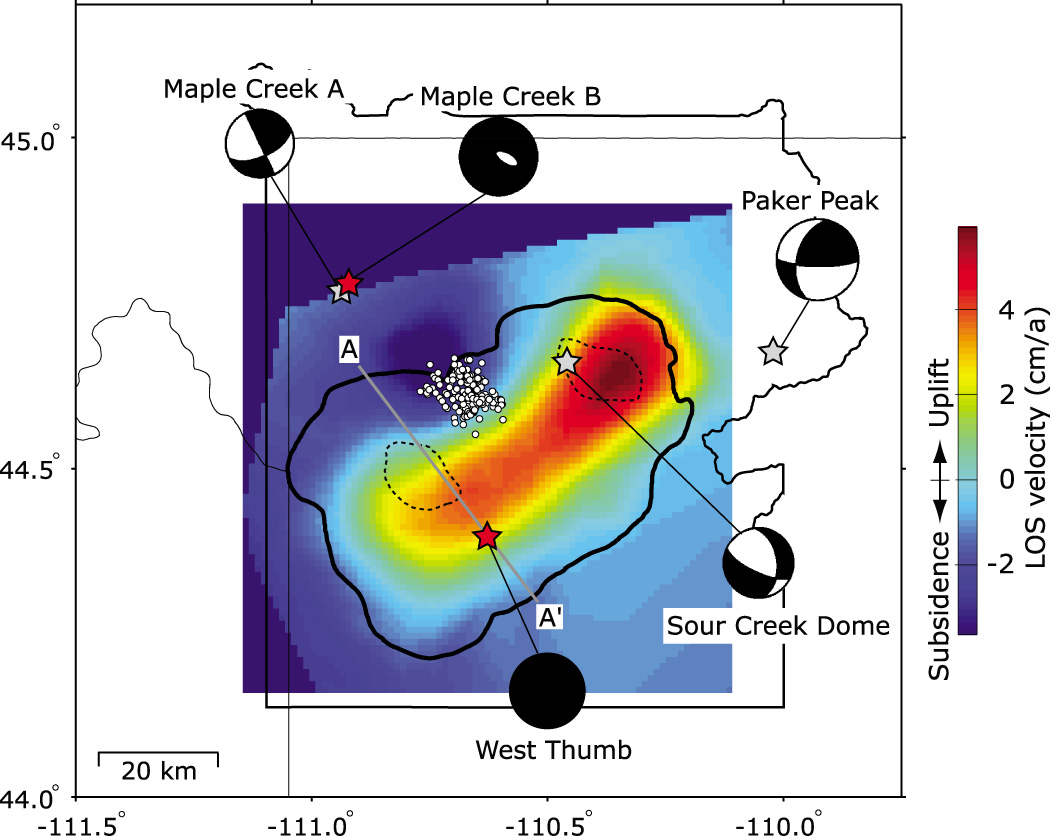
Five earthquakes with magnitude greater than 3 that occurred in 2007-2008 and with good-quality data available were analyzed for their source properties. Of these earthquakes, moment tensor inversions revealed that two of them had had large explosive source volumetric expansion or dilatational source components, in addition to normal fault slip source. These are the first earthquakes identified for which there is good evidence of non-tectonic sources. The 5 November 2007 Mw=3.3 earthquake at West Thumb was consistent with 60% istropic expansion and 40% normal fault. The expansion was estimated at 3.2 cm of opening across a 0.12 km2 area. The 9 January 2008 Mw=3.8 earthquake at Maple Creek was consistent with 70% normal faulting and 30% tensile dislocation corresponding to 3.3 cm of opening of a 0.58 km2 crack. It is hypothesized that the migration of high-pressure hydrothermal fluids played a role in triggering these earthquakes. The ongoing uplift of the Yellowstone Caldera likely induced pore pressure and stress changes that allowed fluid migration to occur.
More Information:
|
|
||||||||||||||||||||||||||||||||||||||||||||||||||||||||||||||||||||||||||||||||||||||||||||||||||||||||||||||||||||||||||||||||||||||||||||||||||||||
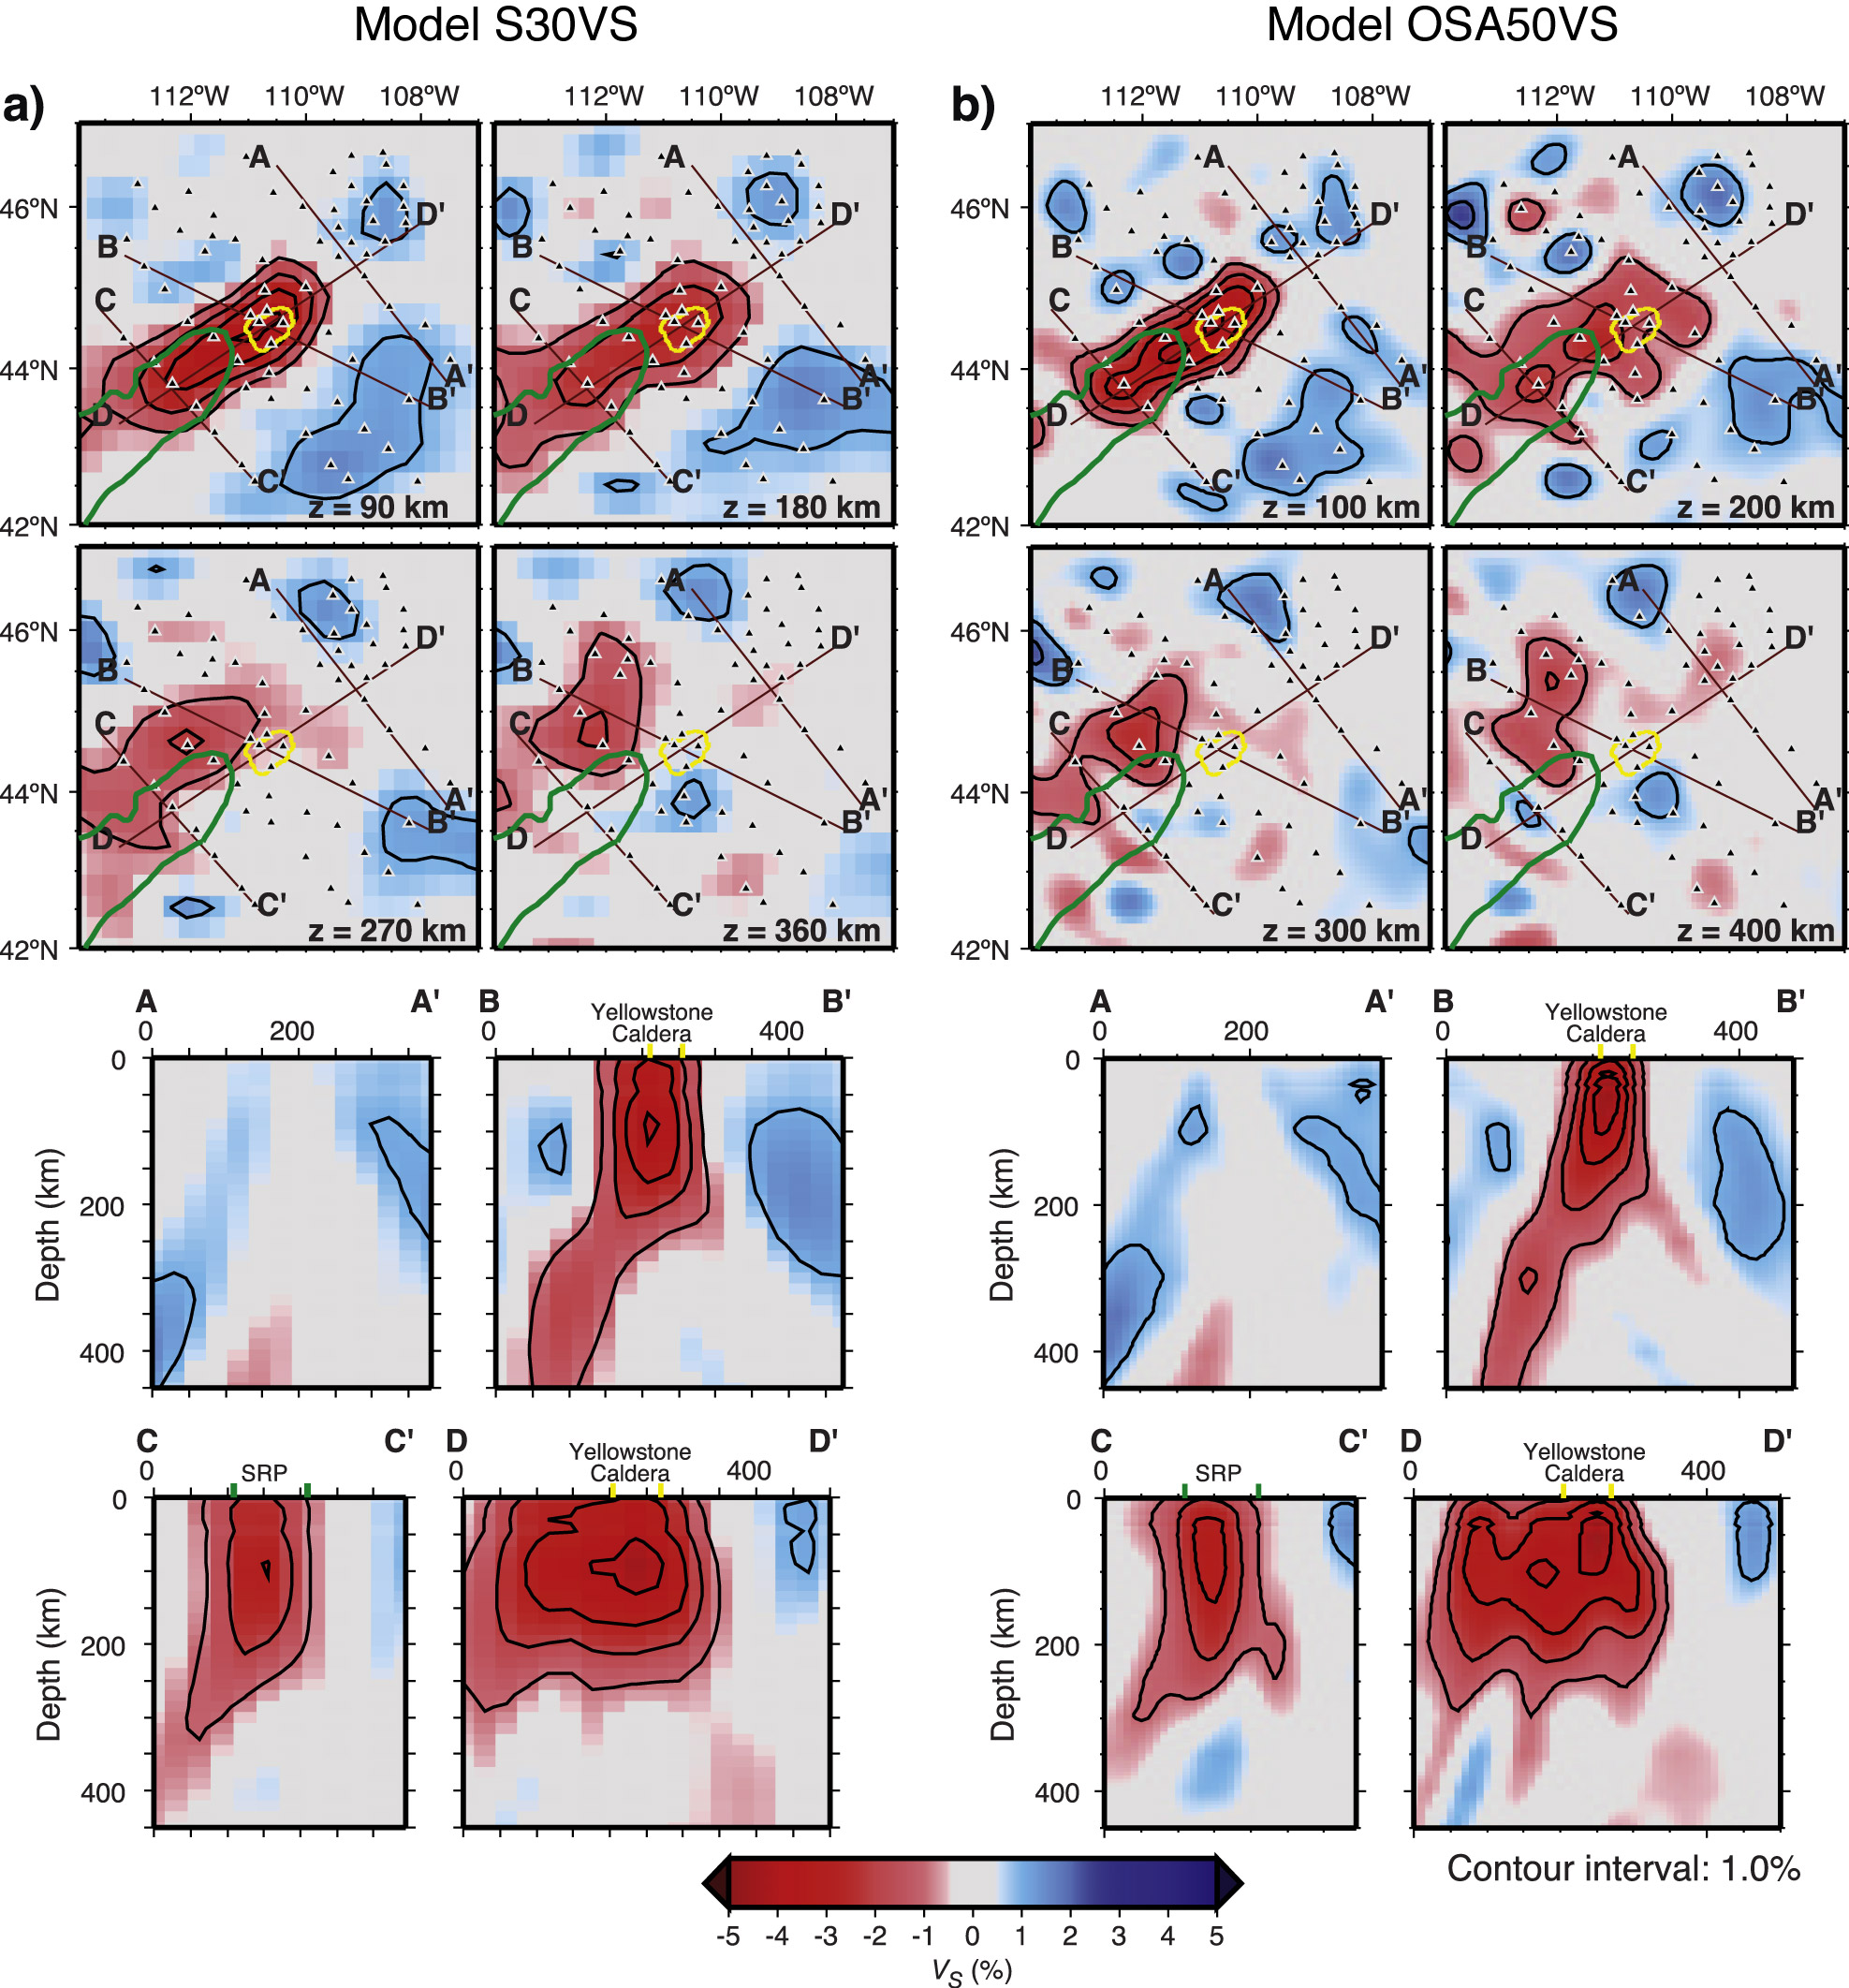
Published in Journal of Volcanology and Geothermal Research in November 2009
The Yellowstone plume has been tomographically imaged as a tilted body extending from 80 km depth at the Yellowstone Plateau to 660 km depth beneath western Montana. Geodynamic modeling of the plume finds that the plume is up to 120 K hotter than the surrounding mantle, with a maximum of 2.5% melt and a small buoyancy flux of 0.25 MG/s, properties of a cool, weak plume. Mantle flow modeling is used to constrain the evolution of the hotspot: the Yellowstone plume initially ascended vertically through the mantle beneath the thin, accreted lithosphere of the Columbia Plateau and was responsible for the 17 Ma flood basalts there. At 12 Ma, the plume passed beneath the thicker North American lithosphere and became entrained in eastward upper mantle return flow, resulting in a shift of volcanic activity to the southeast and the onset of rhyolitic eruptions caused by melting in the lithosphere. As the North America plate moved southwest, hotspot volcanism propagated northeast, and the resulting tectonic and magmatic interactions produced the 700-km-long Yellowstone-Snake River Plain magmatic system.
More Information: |

|
||||||||||||||||||||||||||||||||||||||||||||||||||||||||||||||||||||||||||||||||||||||||||||||||||||||||||||||||||||||||||||||||||||||||||||||||||||||
Published in Journal of Volcanology and Geothermal Research in November 2009
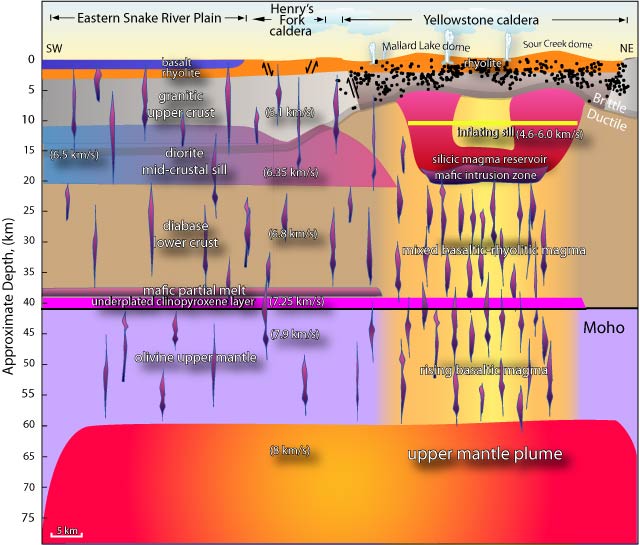
The structure and composition of the Yellowstone-Snake River Plain (YSRP) were modeled from gravity data, with additional constraints from other geophysical data. Strength profiles were also calculated at selected locations. Results from the modeling suggest that the lower crust of the eastern Snake River Plain (ESRP) has been thickened by underplating with a layer of clinopyroxene. A mid-crustal sill of variable thickness of 4 to 11 km and consisting of inter-fingering gabbroic lenses extend along the length of the ESRP and are the crystallized remains of former magma reservoirs. A low-density magma reservoir was modeled beneath the Yellowstone caldera and extending laterally 20 km northeast of the caldera boundary, resulting in a larger body than that imaged by tomography by about 20%. Strength models show that the YSRP crust becomes stronger and cooler with increasing distance from the Yellowstone caldera, where earthquakes are limited to shallow depths of 4-6 km and limited in maximum magnitude to less than M6.5.
More Information:
|
|
||||||||||||||||||||||||||||||||||||||||||||||||||||||||||||||||||||||||||||||||||||||||||||||||||||||||||||||||||||||||||||||||||||||||||||||||||||||
Published in Journal of Volcanology and Geothermal Research in November 2009
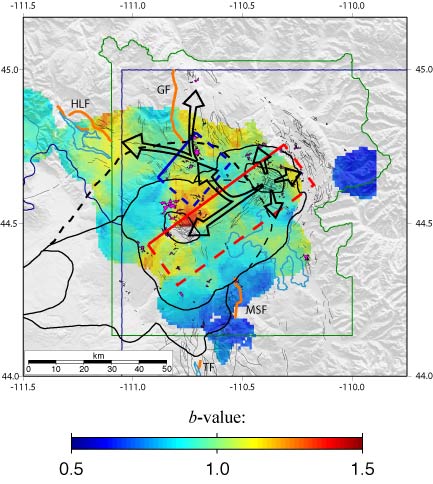
About 40% of the total seismicity in Yellowstone occurs as distinct clusters of events defined as earthquake swarms. Sixty-nine independent earthquake swarms were identified in the Yellowstone catalog from 1984-2006 based on inter-event times and spatial clustering. The swarms varied in duration from 1 to 46 days with the number of events varying from 30 to 722 with magnitudes of -1.2 to 4.8. Inspection of the frequency-magnitude distribution of earthquakes shows a range of b-values from 0.6 ± 0.1 to 1.5 ± 0.05. The highest values (1.5 ± 0.05) are associated with the youthful Mallard Lake resurgent dome. These variations are interpreted to be related to variations in stresses accompanying the migration of magmatic and hydrothermal fluids. An area of low b-values (0.6 ± 0.1) south of the Yellowstone caldera is interpreted as evidence of a relatively higher stress regime associated with an area of dominantly extensional focal mechanisms.
More Information:
|
|
||||||||||||||||||||||||||||||||||||||||||||||||||||||||||||||||||||||||||||||||||||||||||||||||||||||||||||||||||||||||||||||||||||||||||||||||||||||
Published in Journal of Volcanology and Geothermal Research in November 2009
Probablistic seismic hazards were estimated for the Yellowstone and Teton regions using new, more accurately located earthquake catalogues, geologic fault slip rates, and background earthquake occurrence rates. The new earthquake catalogues were determined from three- dimensional seismic velocity models, resulting in more precise hypocenters. The results of the analysis reveal that the greatest hazards are associated with the Teton fault, which has a high slip rate of 1.3 mm/yr yet is seismically quiescent with diffuse earthquake distribution only in the southern Jackson Hole Valley and Gros Ventre Range. In Yellowstone, hazards are associated with the active earthquake zone between the Hebgen Lake fault zone and northern caldera boundary, as well as the Mt. Sheridan fault in southeast Yellowstone, which slip rates of 1.4 mm/yr. The Yellowstone-Teton region is among the regions of highest seismic hazard in the western U.S.
More Information:
|

|
||||||||||||||||||||||||||||||||||||||||||||||||||||||||||||||||||||||||||||||||||||||||||||||||||||||||||||||||||||||||||||||||||||||||||||||||||||||
Published in National Geographic in August 2009
An overview of the Yellowstone supervolcano, from the hotspot source to the volcanic history to current activity. Robert B. Smith, University of Utah, was a principal consultant and the University of Utah Seismology Research Group provided the basic plume and and earthquake data for the article.
More Information:
|
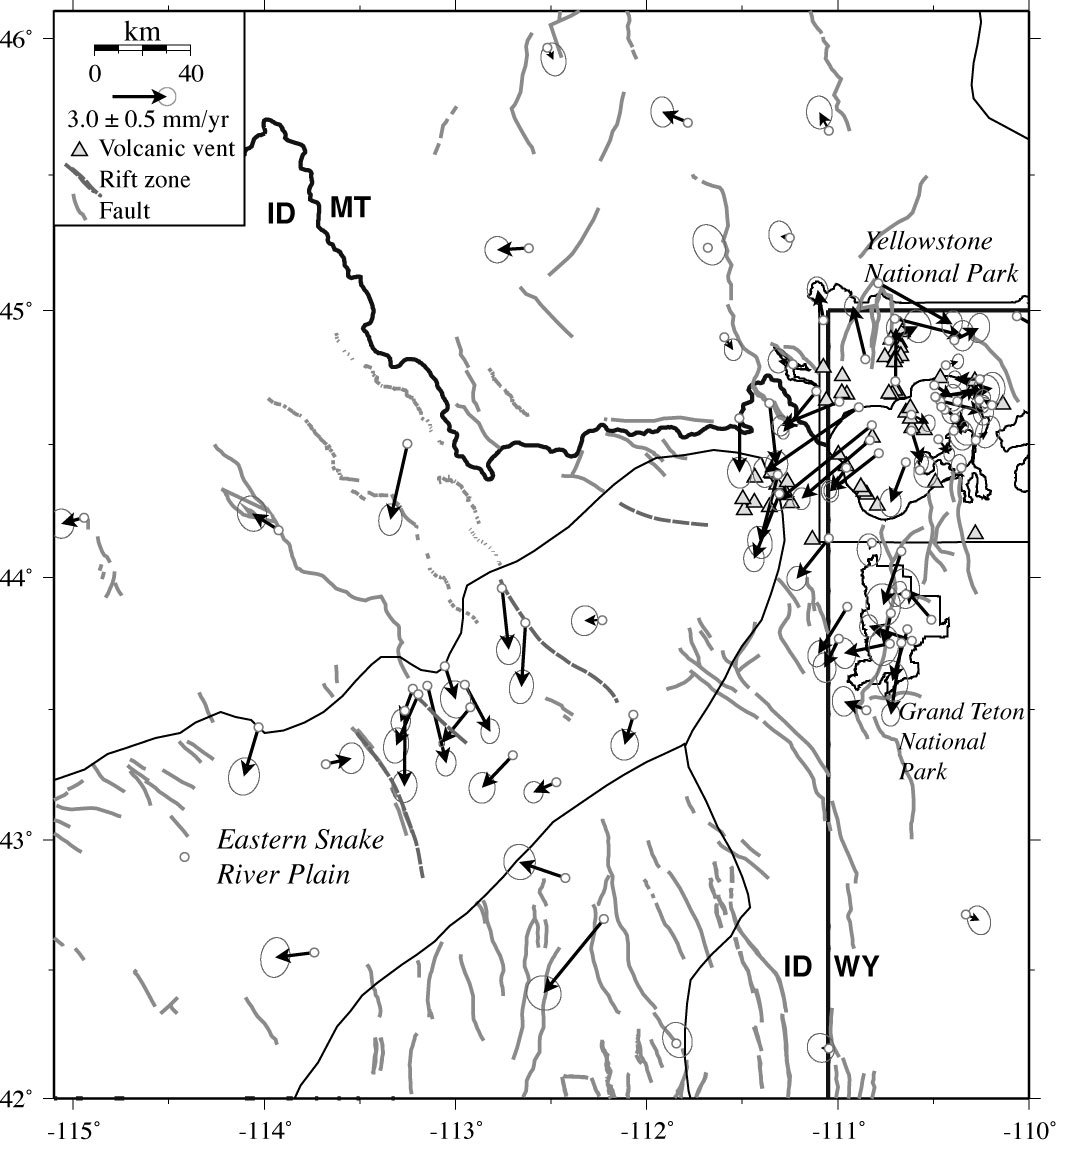
Published in Journal of Geophysical Research in April 2009
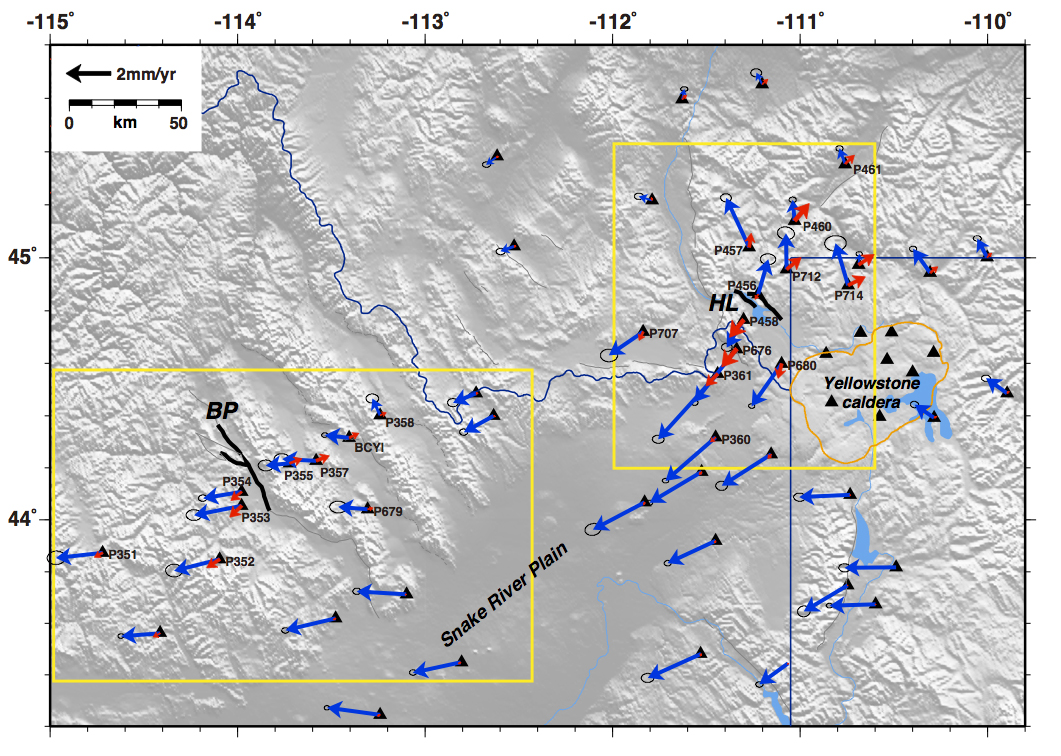
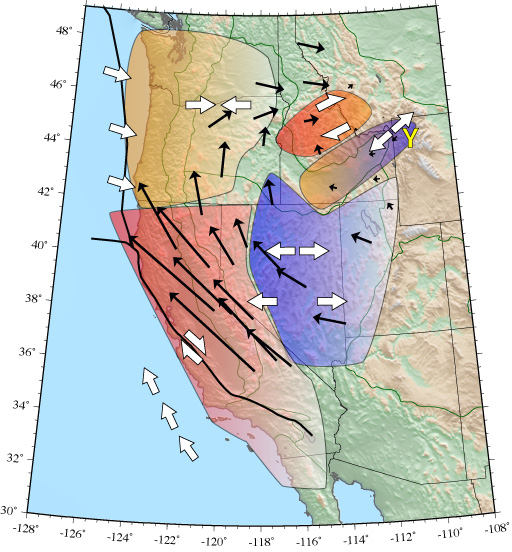
Contemporary deformation of the Yellowstone hot spot and surrounding western United States is analyzed using tectonic microplate modeling, employing constraints from GPS observations corrected for postseismic deformation of M7+ earthquakes, fault slip rates, and earthquake focal mechanisms. We focus primarily on the kinematics of the Yellowstone hot spot and the eastern Snake River Plain volcanic field (ESRP), and secondarily on Basin-Range and Columbia Plateau provinces. This study reveals that the overall motion of the western United States is characterized by clockwise rotation, with westward extension and northwest shear in the Basin-Range province, northeast to east contraction in the Columbia Plateau, and southwest extension of the Yellowstone - Snake River Plain block that is driven by the high gravitational potential of the Yellowstone swell.
More Information:
|
|
||||||||||||||||||||||||||||||||||||||||||||||||||||||||||||||||||||||||||||||||||||||||||||||||||||||||||||||||||||||||||||||||||||||||||||||||||||||
Published in Science on November 09 2007
The Yellowstone caldera began an extraordinary episode of ground rising in mid-2004, revealed by GPS (Global Positioning System) and InSAR (Interferometric Synthetic Aperture Radar) measurements, at rates up to 7 cm/yr that is over three times faster than previously observed inflation rates. The caldera-wide accelerated uplift is interpreted as magmatic recharge of the Yellowstone magma body. While the geodetic observations and models do not imply an impending volcanic eruption or hydrothermal explosion, they are important evidence of on going processes of a large caldera that was produced by a super volcano eruption.
More Information:
|

|

|
||||||||||||||||||||||||||||||||||||||||||||||||||||||||||||||||||||||||||||||||||||||||||||||||||||||||||||||||||||||||||||||||||||||||||||||||||||||
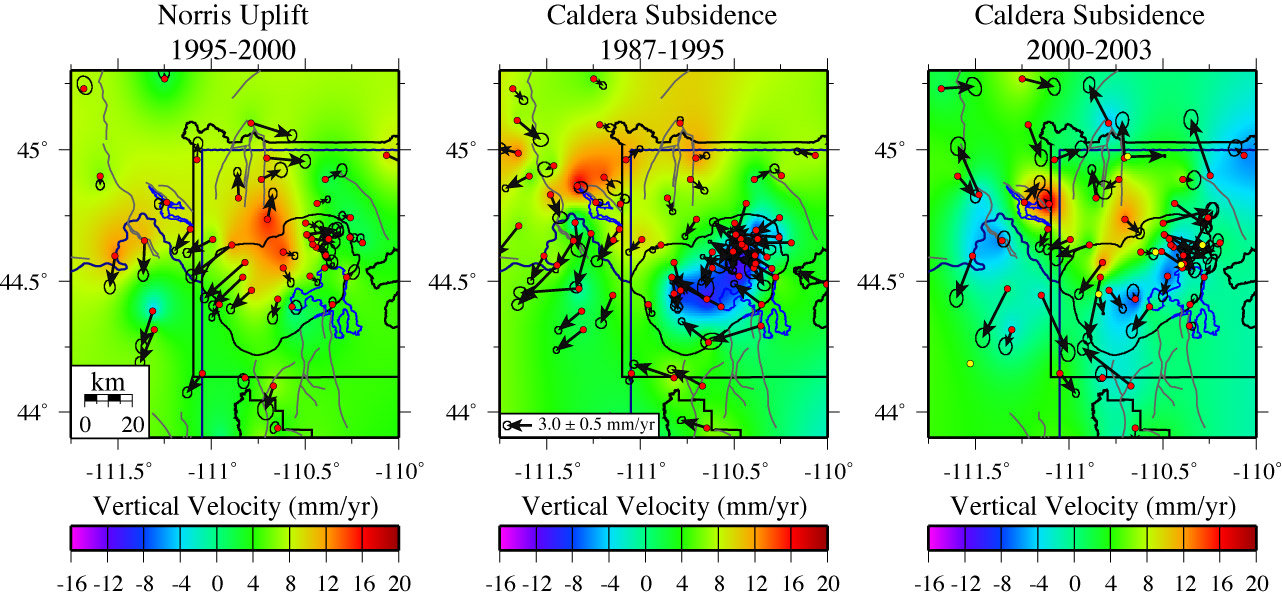
Published in Journal of Geophysical Research in July 2007
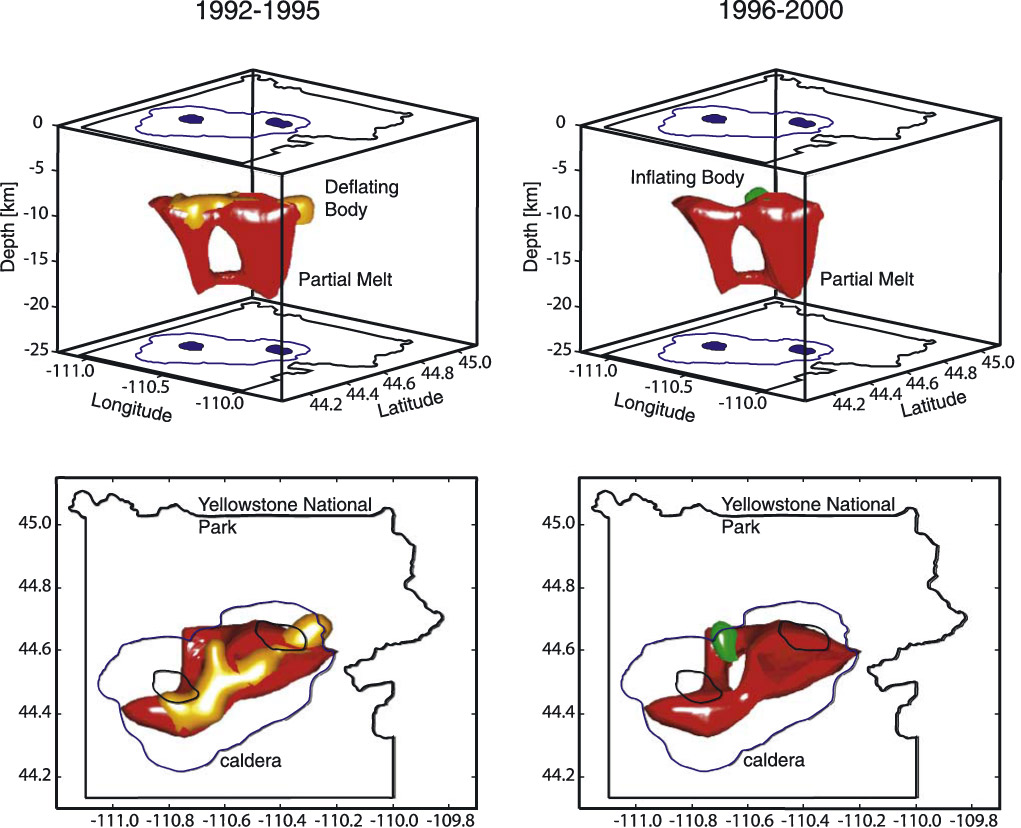
Measurements from GPS and Interferometric Synthetic Aperture Radar (InSAR) were used to constrain models of subsurface volume change at the Yellowstone volcanic system. GPS ground velocities were calculated for the periods 1991-1995 and 1995-2000 and then combined with InSAR range velocities for the periods of 1992-1995 and 1996-2000, respectively, to construct source models. The caldera underwent subsidence during the first period and uplift at its northern boundary during the second period. Additional InSAR-only models were constructed for caldera subsidence during 2000-2001 and 2001- 2002. The source for the 1992-1995 period was modeled as a contracting body at 6-10 km depth along the long axis of the caldera, below the Mallard Lake resurgent dome and extending northeast below the Elephant Back fault zone, Sour Creek resurgent dome, and Hot Springs Basin. A lobe branches from the main body and extends northward toward the northern caldera boundary. For the 1996-2000 period, the source was modeled as a body below the north caldera boundary at 6-8 km depth. For 2000-2001, deformation was modeled as two bodies with a shallow inflating body at 4-6 km depth at the northern caldera boundary and a deflating body at 6-8 km along the caldera axis. For 2001-2002, shallow inflation was modeled at 2-4 km depth at the north boundary, while deflation continued at 6-8 km depth in the caldera. The deforming body below the caldera surface lies just above the crustal magma reservoir, and its position is aligned with the resurgent domes and Elephant Back fault zone, suggesting that the fault zone acts as a zone of weakness or conduit for fluid flow. The deforming body at the north caldera boundary is aligned with volcanic vent distribution within the caldera and normal fault zones outside the caldera.
More Information:
|
|
||||||||||||||||||||||||||||||||||||||||||||||||||||||||||||||||||||||||||||||||||||||||||||||||||||||||||||||||||||||||||||||||||||||||||||||||||||||
Published in Journal of Geophysical Research in March 2007
The University of Utah conducted seven GPS campaigns at 140 sites in the Yellowstone-Snake River Plain volcanic system between 1987 and 2003 and installed a network of 15 permanent stations. Analysis of the GPS measurements revealed periods of uplift and subsidence at the Yellowtone caldera. From 1987 to 1995, the caldera subsided at a maximum rate of 14 mm/yr. From 1995 to 2000, the center of deformation shifted to the north caldera boundary, which rose at up to 15 mm/yr. Subsidence resumed in the the calder between 2000 and 2003 at 9 mm/yr, while uplift continued at the north caldera boundary at 12 mm/yr. These rates contrast are an order of magnitude less than the accelerated uplift, which began in 2004. The caldera deformation was hypothesized to arise from the accumulation and release of brines or other fluids from the magma chamber. The study additionally measured extension across the caldera at 2-4 mm/yr and southwest motion of the eastern Snake River Plain at 2.1 mm/yr.
More Information:
|
|
|
||||||||||||||||||||||||||||||||||||||||||||||||||||||||||||||||||||||||||||||||||||||||||||||||||||||||||||||||||||||||||||||||||||||||||||||||||||||
Published in Journal of Geophysical Research in April 2006
The development of the 16 Ma Yellowstone-Snake River Plain volcanic system has been attributed to the North America lithosphere moving over a stationary mantle plume, but the plume itself remained unresolved because of a lack of seismic data. New seismic data now provide strong evidence for an upper mantle plume to depths of 450 km below the Yellowstone caldera and eastern Snake River Plain. Distant earthquakes were recorded on two temporary seismograph arrays operated from 1999-2003 in 500x600-km area centered on Yellowstone and analysed to obtain a model of seismic velocities beneath Yellowstone. The tomographyic analysis revealed a body with anomalously low seismic velocities in the upper mantle that tilted 30°, so that the body becomes offset to the north with increasing depth. These results are consistent with an upwelling of hot material (i.e., a plume) in the upper mantle. Furthermore, the tilting of the plume is consistent horizontal flow of mantle material interacting with the plume.
More Information: |
|
||||||||||||||||||||||||||||||||||||||||||||||||||||||||||||||||||||||||||||||||||||||||||||||||||||||||||||||||||||||||||||||||||||||||||||||||||||||
US Geological Survey Fact Sheet, published 2005
Yellowstone, one of the world's largest active volcanic systems, has produced several giant volcanic eruptions in the past few million years, as well as many smaller eruptions and steam explosions. Although no eruptions of lava or volcanic ash have occurred for many thousands of years, future eruptions are likely. In the next few hundred years, hazards will most probably be limited to ongoing geyser and hot-spring activity, occasional steam explosions, and moderate to large earthquakes. To better understand Yellowstone's volcano and earthquake hazards and to help protect the public, the U.S. Geological Survey, the University of Utah, and Yellowstone National Park formed the Yellowstone Volcano Observatory, which continuously monitors activity in the region.
More Information:
|
|||||||||||||||||||||||||||||||||||||||||||||||||||||||||||||||||||||||||||||||||||||||||||||||||||||||||||||||||||||||||||||||||||||||||||||||||||||||
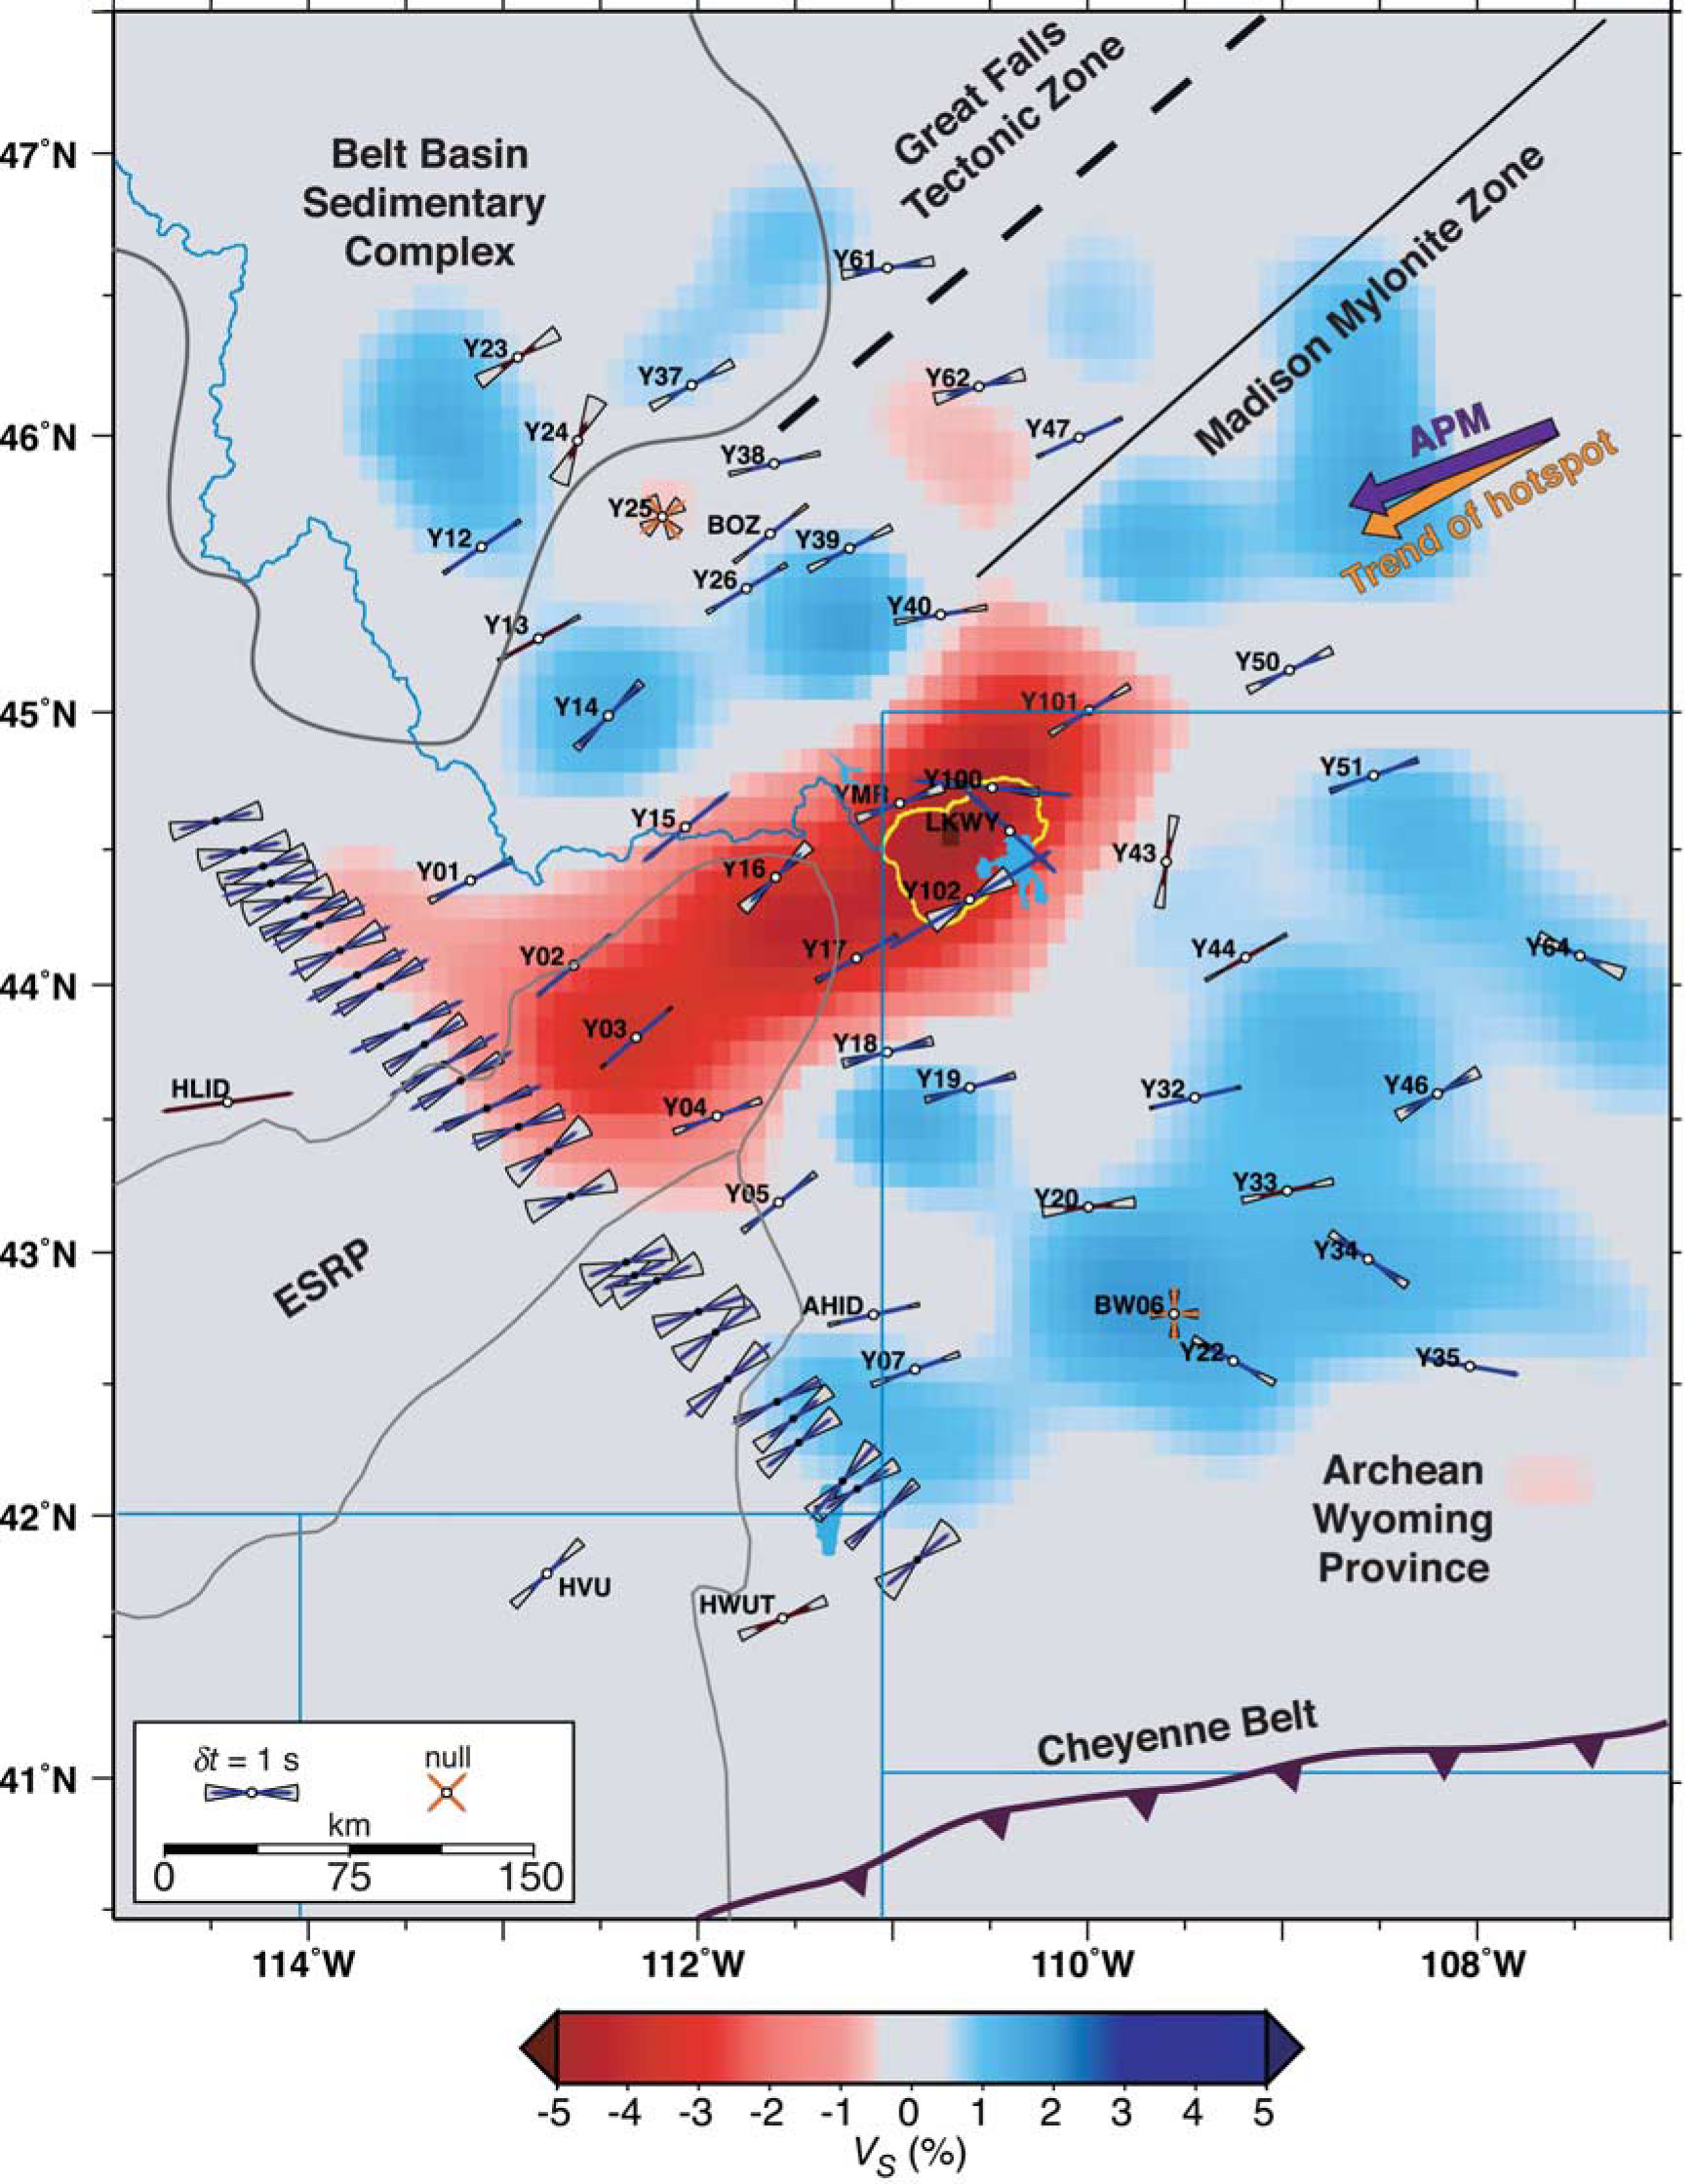
Published in Journal of Geophysical Research in November 2005
Teleseismic shear waves from 91 earthquakes recorded at 56 stations in a 500x600-km seismograph network centered on the Yellowstone hotspot and analyzed for splitting as the shear waves traveled through mantle olivine crystals. The analysis determined the azimuth of shear wave polarization and difference in arrival time between shear waves polarized along the fast and slow axes of the olivine crystals, allowing the inference of mantle flow direction that would align individual crystals. The average split time from all stations was found to be 0.9 seconds, typical of continents. No evidence was found for plume-induced radial strain, indicating that gravitational spreading of plume material had no detectable effect on fast axis orientation, and that such orientations were dominated by plate motions. Two stations within the Yellowstone Plateau were found to have fast anisotropy directions nearly perpendicular to plate motion and large split times of over 2 seconds, and these were attributed to melt-fill, stress-oriented cracks in the lithosphere. Stations to the southeast of Yellowstone also had anomalous fast axis directions that may reflect the fabric of local Archean lithosphere.
More Information: |
|
||||||||||||||||||||||||||||||||||||||||||||||||||||||||||||||||||||||||||||||||||||||||||||||||||||||||||||||||||||||||||||||||||||||||||||||||||||||
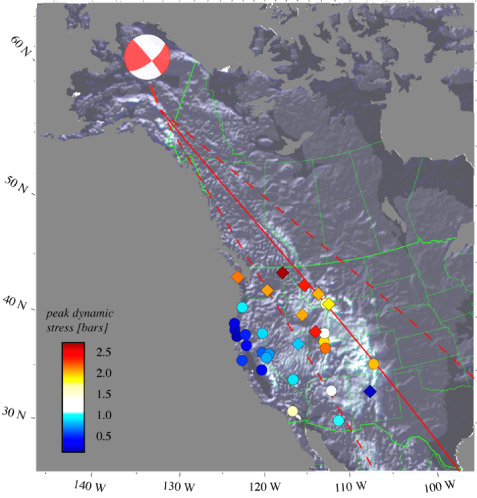
Published in Bulletin of the Seismological Society of America in December 2004
Coincident with the arrival of low-frequency, large-amplitude surface waves of the Mw 7.9 Denali fault earthquake (DFE), an abrupt increase in seismicity was observed in the Yellowstone National Park region, despite the large epicentral distance of 3100 km. Within the first 24 hr following the DFE mainshock, we located more than 250 earthquakes, which occurred throughout the entire Yellowstone National Park region. The elevated seismicity rate continued for about 30 days and followed a modified Omori law decay with a P value of 1.02 # 0.07. For a declustered earthquake catalog, the seismicity following the 2002 DFE uniquely stands out with a significance of 30r. The increase in seismicity occurred over all magnitude bands. In general, we observed that seismicity following the DFE outlined the spatial pattern of past seismicity routinely observed in the Yellowstone National Park region. However, we found significant differences in triggered seismicity inside and outside the caldera. Earthquakes inside the Yellowstone caldera occurred preferentially as clusters close to major hydrothermal systems, were of larger magnitude, and seismicity decayed more rapidly. This suggests that either different trigger mechanisms were operating inside and outside the caldera or that the crust responded differently to the same trigger mechanism depending on its different mechanical state. Compared with other sites that experienced remote earthquake triggering following the 2002 DFE, Yellowstone showed the most vigorous earthquake activity. We attribute this to strong directivity effects of the DFE, which caused relatively large peak dynamic stresses (0.16-0.22 MPa) in Yellowstone, and to the volcanic nature of Yellowstone.
More Information:
|
|
||||||||||||||||||||||||||||||||||||||||||||||||||||||||||||||||||||||||||||||||||||||||||||||||||||||||||||||||||||||||||||||||||||||||||||||||||||||
Published in Geology in June 2004
Following the 2002 M 7.9 Denali fault earthquake, clear changes in geyser activity and a series of local earthquake swarms were observed in the Yellowstone National Park area, despite the large distance of 3100 km from the epicenter. Several geysers altered their eruption frequency within hours after the arrival of large-amplitude surface waves from the Denali fault earthquake. In addition, earthquake swarms occurred close to major geyser basins. These swarms were unusual compared to past seismicity in that they occurred simultaneously at different geyser basins. We interpret these observations as being induced by dynamic stresses associated with the arrival of large-amplitude surface waves. We suggest that in a hydrothermal system dynamic stresses can locally alter permeability by unclogging existing fractures, thereby changing geyser activity. Furthermore, we suggest that earthquakes were triggered by the redistribution of hydrothermal fluids and locally increased pore pressures. Although changes in geyser activity and earthquake triggering have been documented elsewhere, here we present evidence for changes in a hydrothermal system induced by a large-magnitude event at a great distance, and evidence for the important role hydrothermal systems play in remotely triggering seismicity.
More Information:
|
|
||||||||||||||||||||||||||||||||||||||||||||||||||||||||||||||||||||||||||||||||||||||||||||||||||||||||||||||||||||||||||||||||||||||||||||||||||||||
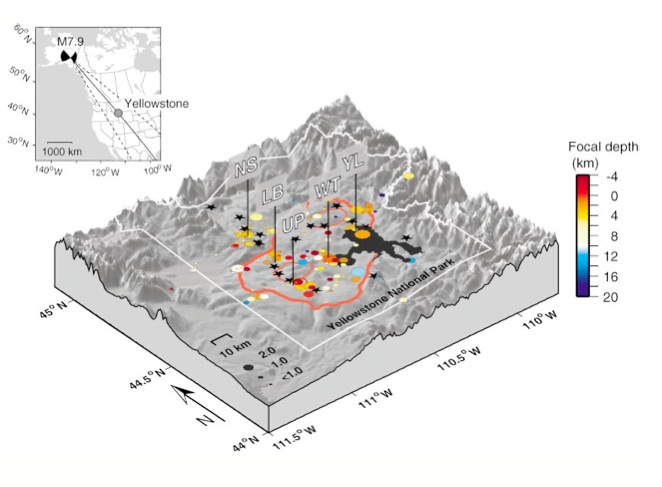
Published in Bulletin of Seismological Society of America in June 2004
Recorded seismicity for the Yellowstone National Park region, comprising 25,267 earthquakes from November 1972 to December 2002, has been relocated using three-dimensional velocity models and probabilistic earthquake location. In addition, new coda magnitudes for earthquakes between 1984 and 2002 were computed by using an improved coda magnitude equation. Three-dimensional velocity models for earthquake location were computed by inverting subsets of high-quality data of three different periods, 1973-1981, 1984-1994, and 1995-2002, for hypocenter locations and seismic velocities. Earthquakes were relocated by using a nonlinear, probabilistic solution to the earthquake location problem. Fully nonlinear location uncertainties included in the probabilistic solution allow a better and more reliable classification of earthquake locations into four quality classes. Earthquake locations show an improvement in location accuracy with time, which we attribute to improved network geometry and more precise timing of arrival times. No large systematic shifts of the relocated earthquake locations are observed, except a systematic shift of #2 km to greater depth. The new relocated earthquake locations show tighter clustering of epicenters and focal depths when compared with original earthquake locations. The most intense seismicity in terms of number of earthquakes and cumulative seismic moment release in the Yellowstone National Park region occurs northwest of the Yellowstone caldera between Hebgen Lake and the northern rim of the caldera. Seismicity within the Yellowstone caldera is diffuse, and shallow individual clusters of earthquakes can be associated with major hydrothermal areas.
More Information:
|
|||||||||||||||||||||||||||||||||||||||||||||||||||||||||||||||||||||||||||||||||||||||||||||||||||||||||||||||||||||||||||||||||||||||||||||||||||||||
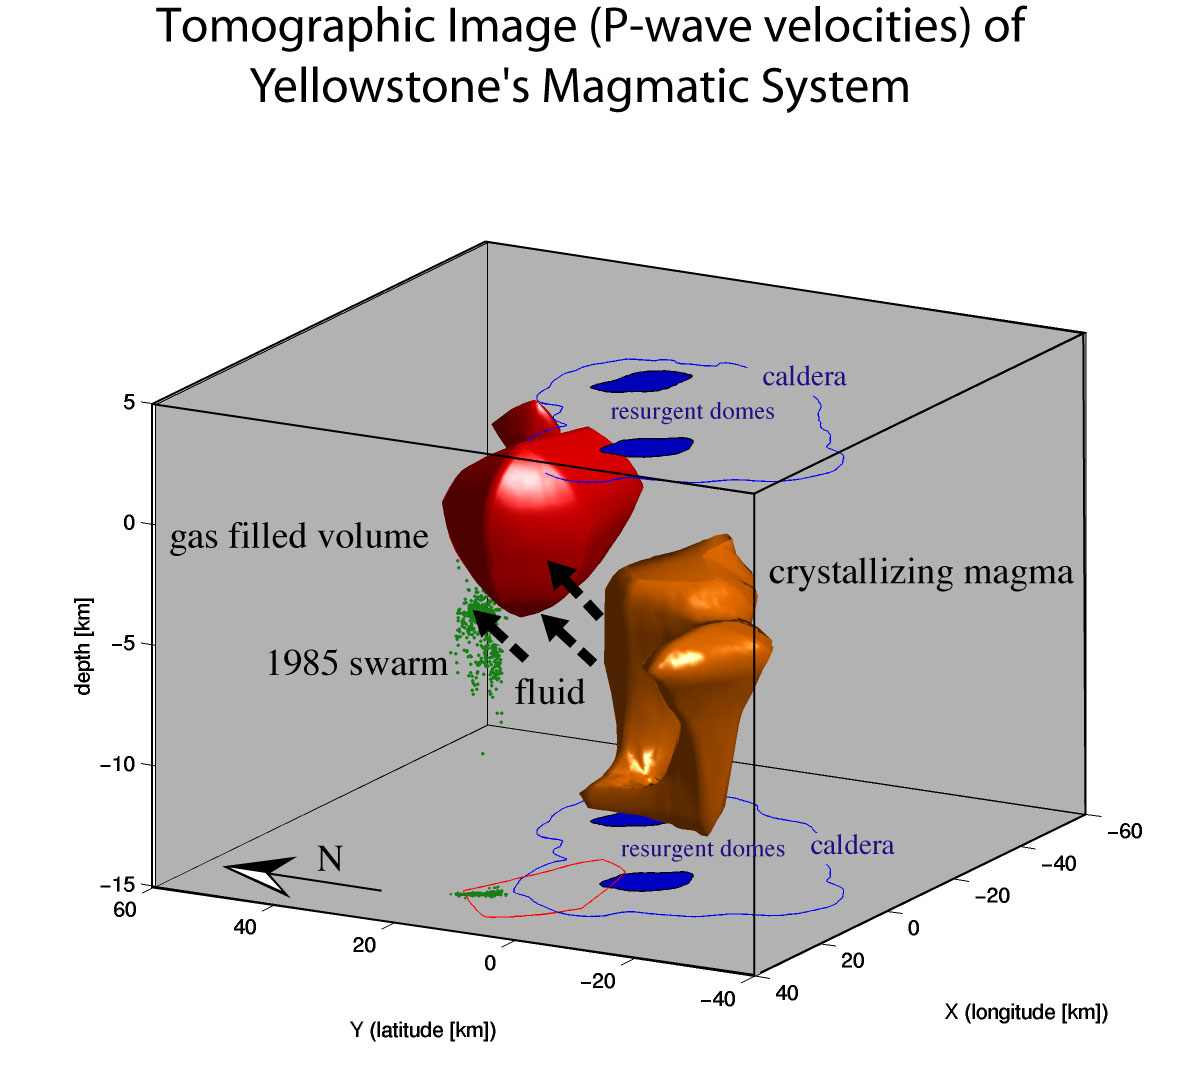
Published in Journal of Volcanology and Geothermal Research in March 2004
Local earthquake tomography was used to determine the P-wave and P-wave to S-wave velocity structure at Yellowstone National Park. A body with anomalously low P-wave velocities was found below the Yellowston caldera at depths greater than 8 km and interpreted to be a magma chamber of partially molten rock. Another anomaly of low Vp and Vp/Vs was found at shallow depths of 2 km at the northwest caldera boundary. This shallow anomaly is consistent with porous, gas-filled rock, with the gas probably being CO2. The release of magmatic fluids such as CO2 exsolved from the crystallizing magma may be associated with earthquake swarms in Yellowstone.
More Information:
|
|
||||||||||||||||||||||||||||||||||||||||||||||||||||||||||||||||||||||||||||||||||||||||||||||||||||||||||||||||||||||||||||||||||||||||||||||||||||||
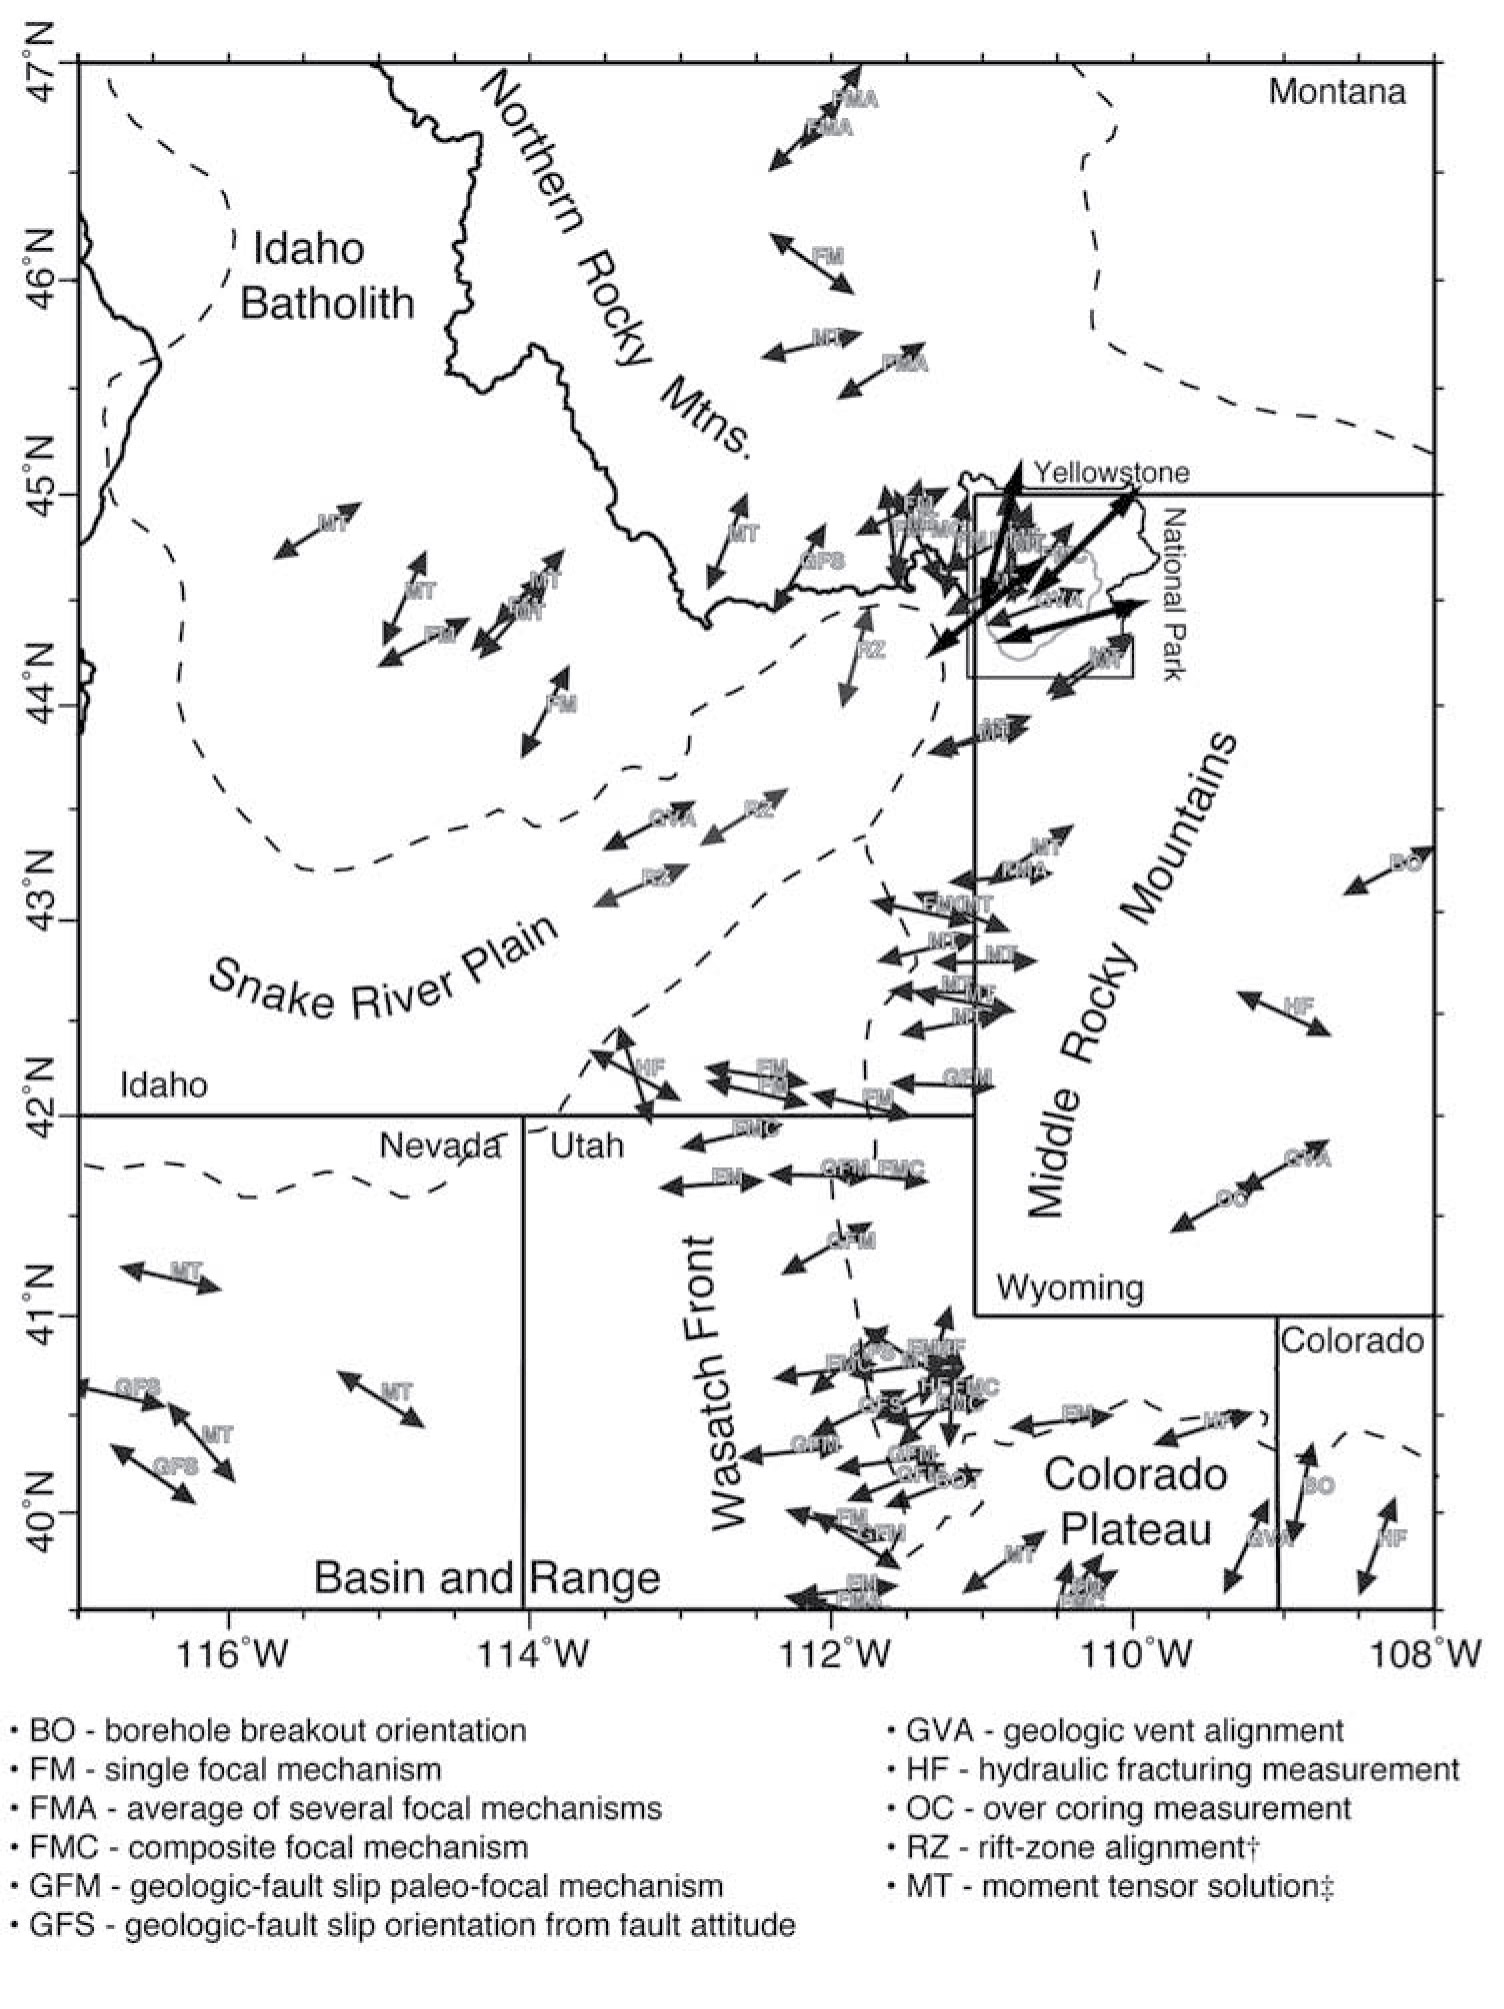
Published in Journal of Geophysical Research in February 2004
The Yellowstone catalog was relocated using a three-dimensional velocity model and focal mechanisms were calculated for 364 earthquakes. The focal mechanisms confirm that normal faulting and extension is dominant at the Yellowstone volcanic field. T axes from the focal mechanisms were used as proxies for tensional stress directions, and analysis of the T axes revealed that tensional stress directions varied systematically across the volcanic field, from a N-S direction in the Hebgen Lake region to NE-SW in the Yellowstone caldera. This rotation in the direction of stress was largely corroborated by comparison with other stress indicators: fault orientations, volcanic vent alignments, and GPS-derived strain rates. The primary exception to this pattern was the north-trending Gallatin fault. N-S extension in the Hebgen Lake region may be related to postseismic viscoelastic relaxation in the upper crust and lower mantle following the 1959 M7.5 Hebgen Lake earthquake.
More Information: |
|
||||||||||||||||||||||||||||||||||||||||||||||||||||||||||||||||||||||||||||||||||||||||||||||||||||||||||||||||||||||||||||||||||||||||||||||||||||||
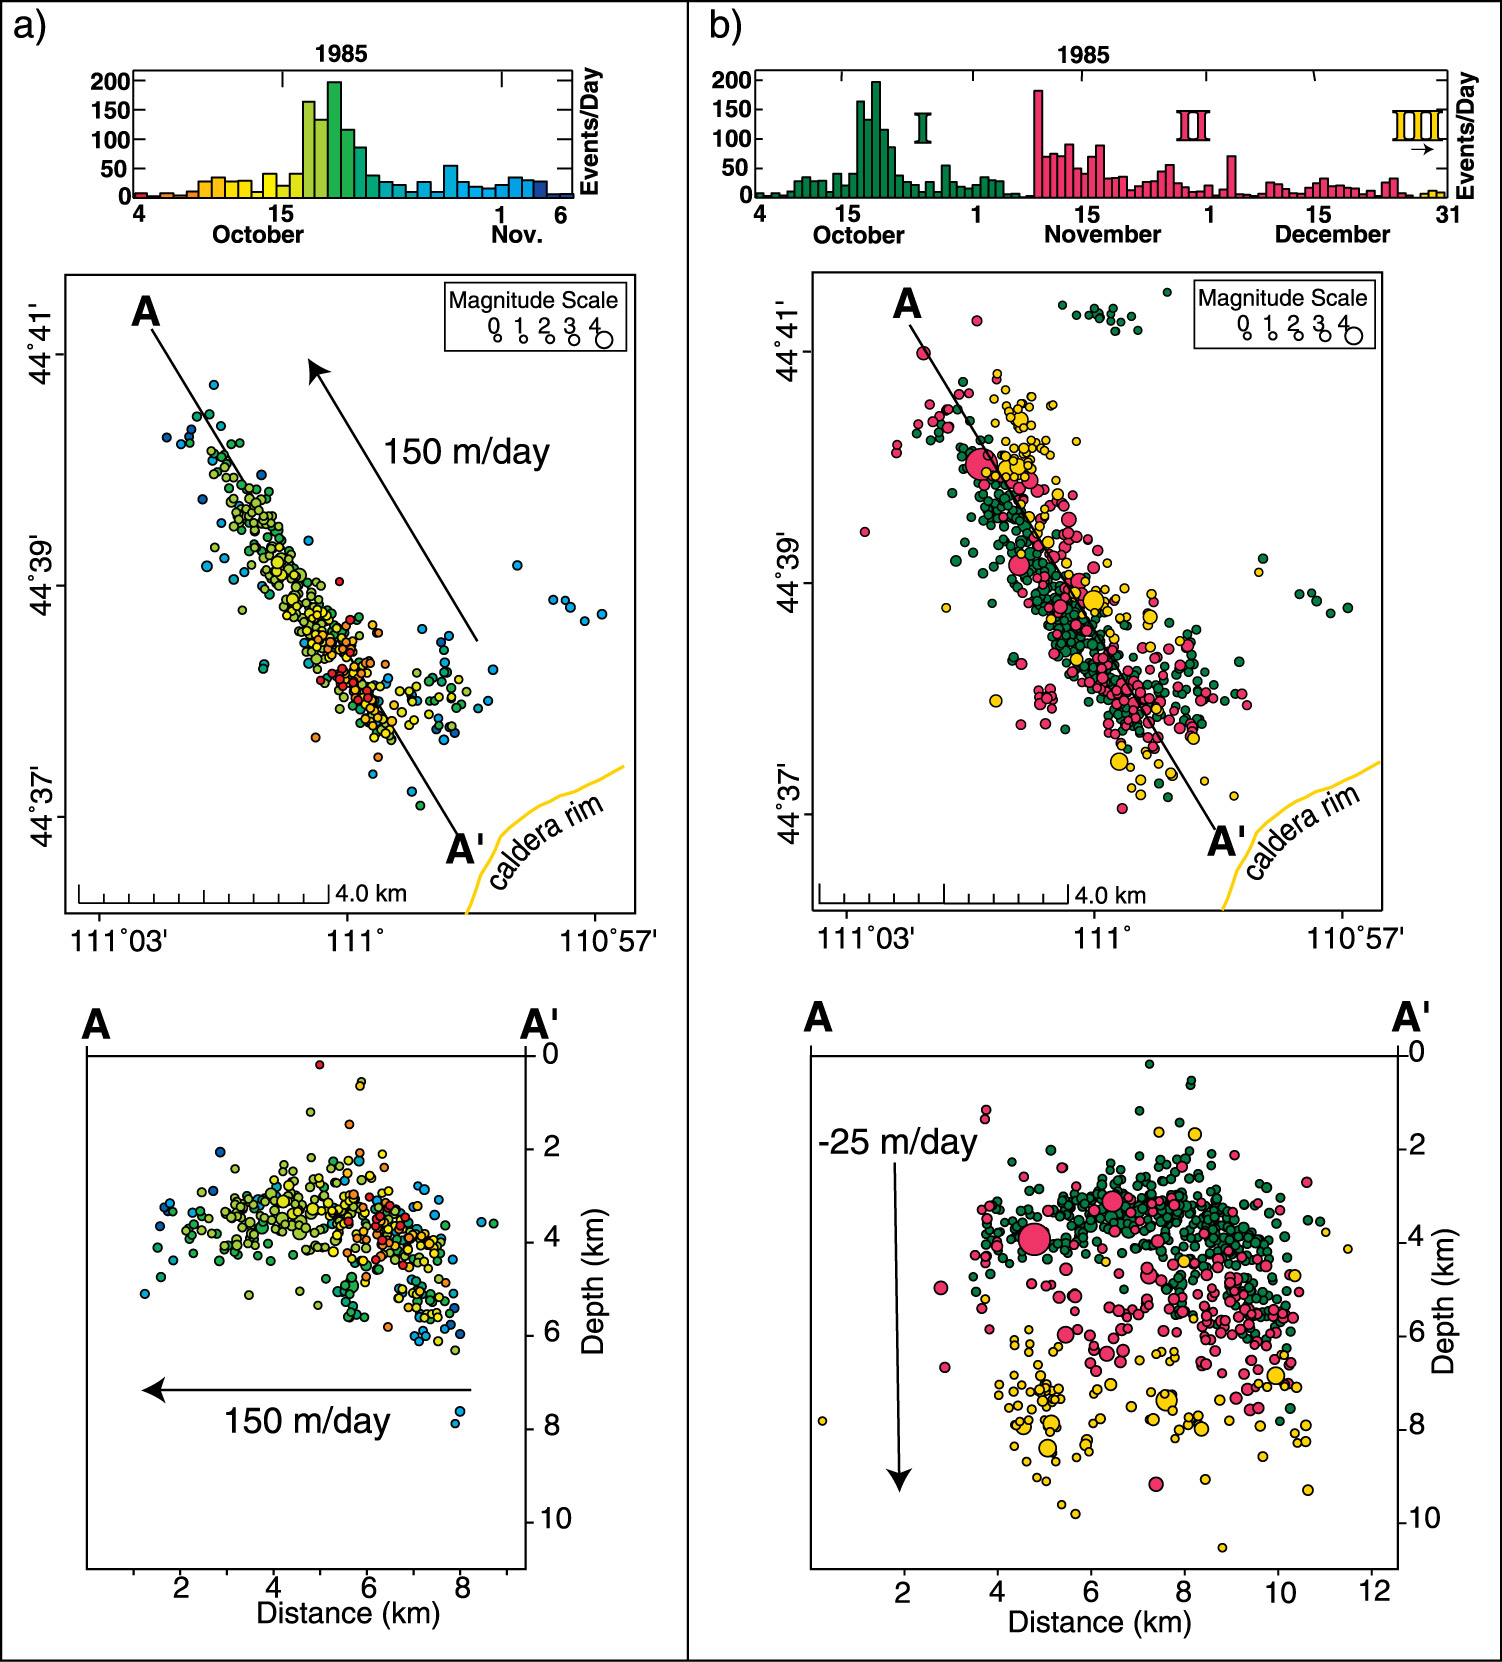
Published in Journal of Geophysical Research in September 2002
The 1985 swarm was the largest swarm recorded in the Yellowstone volcanic field, with over 3000 earthquakes with M<5 between October and December. Analyis of the swarm earthquake revealed several unusual features: hypocenters were distributed in a nearly vertical planar, northwest-trending zone, hypocenters migrated laterally away from the caldera during the first month of the swarm, and dominant focal mechanisms were oblique-normal to strike-slip in contrast with normal-faulting mechanisms of the background seismicity. The maximum principal stress axis was averaged for swarm earthquakes and found to have an orientation rotated from the background seismicity. These features can be best be explained by a model in which hydrothermal fluids migrate away from the caldera following the rupture of a sealed hydrothermal system within the caldera. The escape of hydrothermal fluids may have initiated subsidence in the caldera starting in 1985.
More Information: |
|
||||||||||||||||||||||||||||||||||||||||||||||||||||||||||||||||||||||||||||||||||||||||||||||||||||||||||||||||||||||||||||||||||||||||||||||||||||||
Published in Journal of Geophysical Research in February 1975
A temporary deployment of portable seismometers around Hebgen Lake and western Yellowston National Park was used to characterize local seismicity. The study found a zone of earthquake active extending from Hebgen Lake 80 km east to the edge of the Yellowstone caldera and including the epicenter of the 1959 Hebgen Lake earthquake. Maximimum focal depths were about 15 km in the Hebgen Lake region, but became shallowerto the east with depths of 5 km at the caldera. Composite fault plane solutions revealed north-south extension for most of the earthquake zone, but three anomalous solutions at the northwest caldera boundary found northwest-southeast contraction, which was hypothesized to be related to relative shortening induced by caldera uplift.
More Information:
|
Published in Geological Society of America Bulletin in January 1972
Temporary deployments of portable seismometers at several locations in the Intermountain Seismic Belt (ISB) in 1969 were used to locate and analyze microearthquake. Composite fault plane solutions were for each temporary deployment site. The study found that microearthquake followed the same trend as larger, felt earthquakes recorded by the National Ocean Service/US Coast and Geodetic Survey. Earthquakes occurred at 20-km depths or less with normal faulting. In the northern ISB, at Caribou Mountains and Flathead Lake, extension was to the west-northwest with some reported swarm activity. The southern ISB at the boundary of the Colorado Plateau and Basin and Range, westward extension was associated with near-vertical normal faults.
More Information:
|